Key vocabulary before you start
ECLSS · partial pressure · CO2 scrubber · closed loop · safe haven · EVA
1 — The real phenomenon
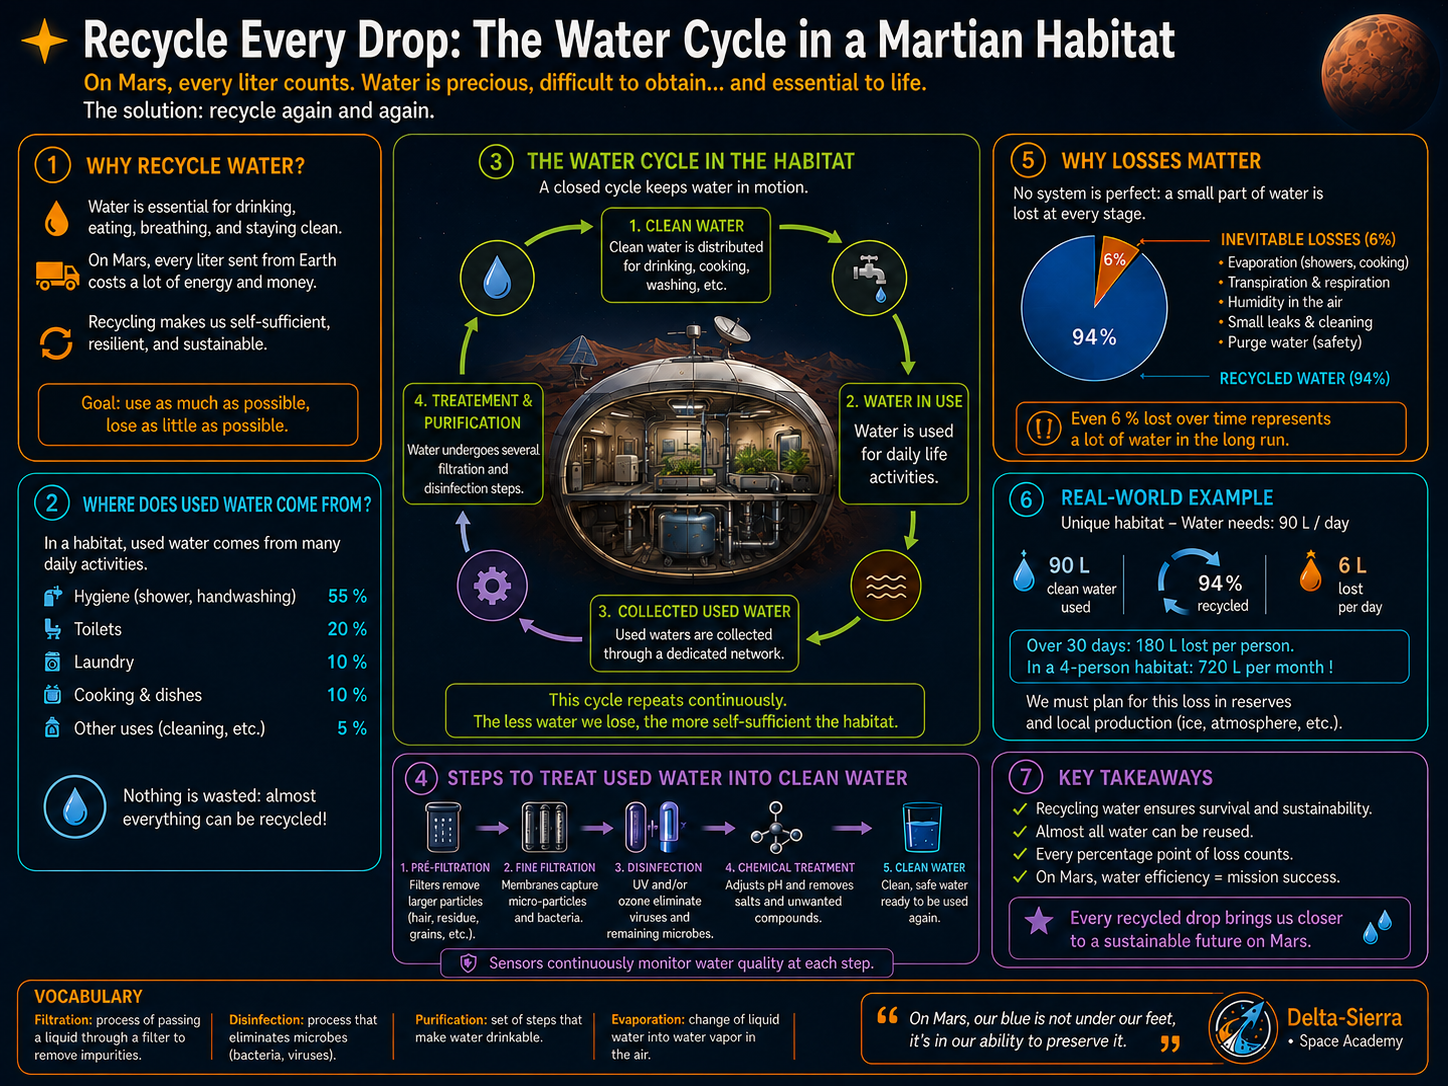
NASA announced in 2023 that the ISS ECLSS demonstrated the approximately 98% overall water-recovery goal with the Brine Processor Assembly. The number describes a system boundary and configuration; it does not mean “98% of everything is recycled,” nor that the remaining losses have the same origin in every architecture. For Mars, a recovery rate must be translated into make-up mass, storage, maintenance, water quality and degraded-mode capability.
The guiding question is: What exactly does “98% recovery” mean, and what happens to the remaining 2%? Reasoning starts with the physical or operational function before introducing the mathematical relationship. The goal is not to accumulate terminology, but to know which quantity changes, why it changes and what becomes hazardous when it leaves its domain. For “Water recovery: correctly understanding NASA’s 98% milestone”, the first task here is therefore to identify the mechanism specific to this subject before searching for an equation or reference value.
2 — Vocabulary and problem boundary
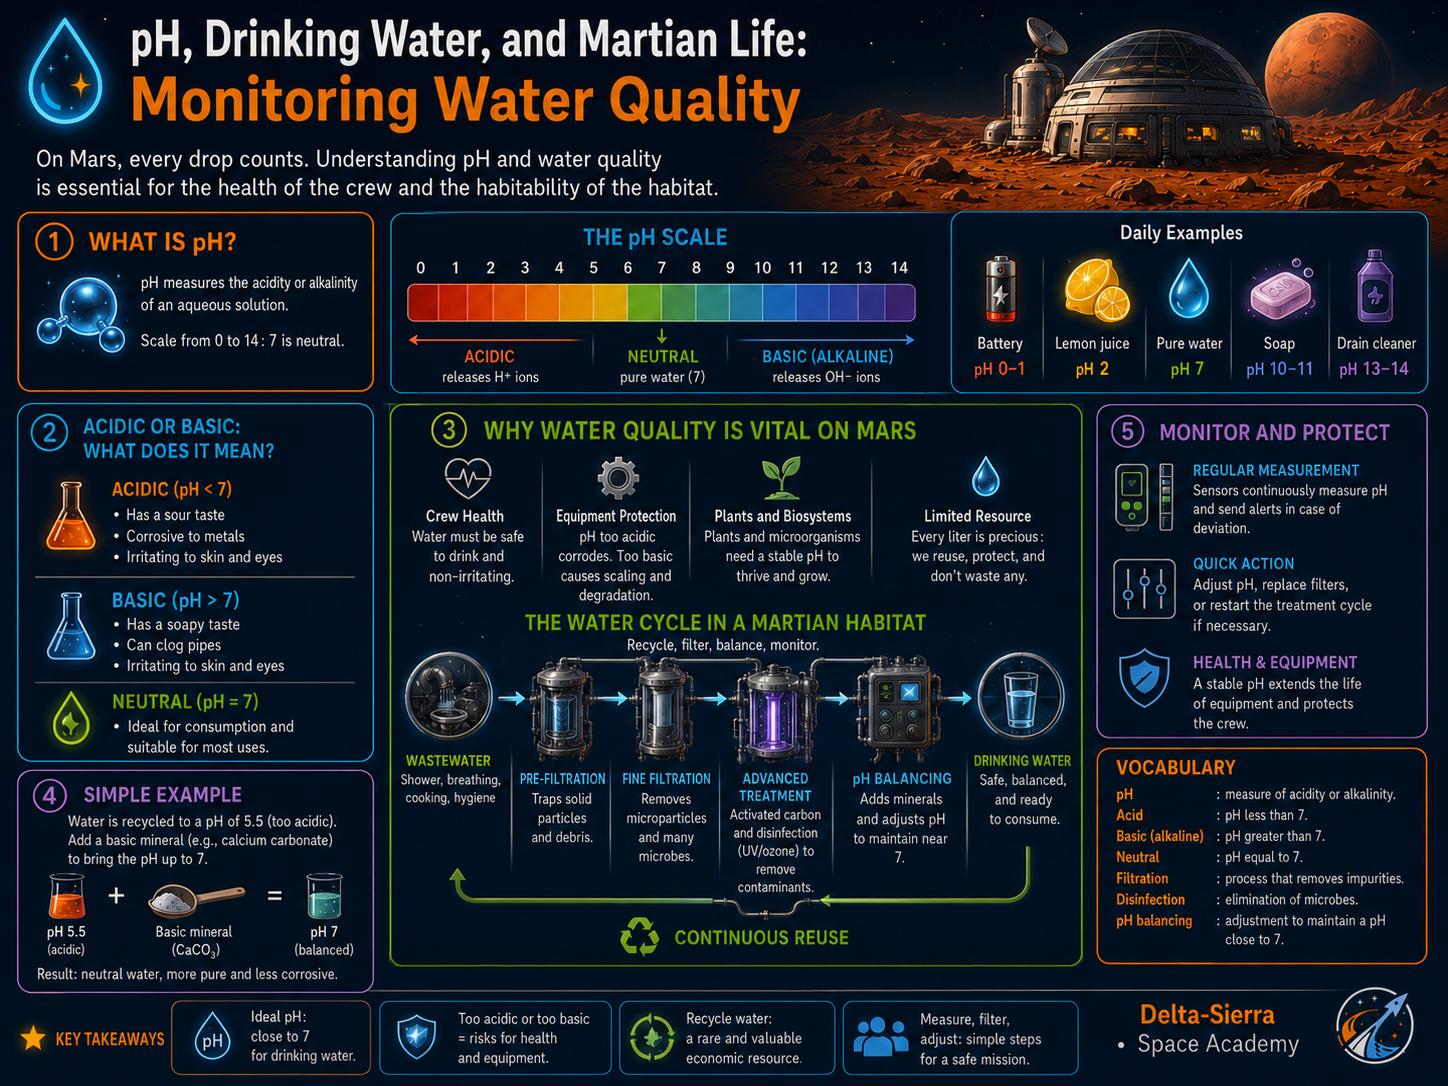
In “Water recovery: correctly understanding NASA’s 98% milestone”, distinguish the phenomenon, available measurement, any command, the margin and the success criterion. The calculation boundary states what is included and excluded; without that boundary, a percentage, mass or time may be mathematically correct but wrong as an engineering conclusion. For “Water recovery: correctly understanding NASA’s 98% milestone”, the chosen boundary also states what would otherwise be double-counted or omitted from a mission budget.
- Primary observable
- flows, conductivity, organic carbon, pressure, temperature, recovery fraction and storage volume
- Characteristic failure
- membrane fouling, bad water-quality sensor, cross contamination or an undersized buffer tank
- Expected evidence
- long-duration tests with representative waters, mass balances and microbiological/chemical analyses
3 — Course-specific system view
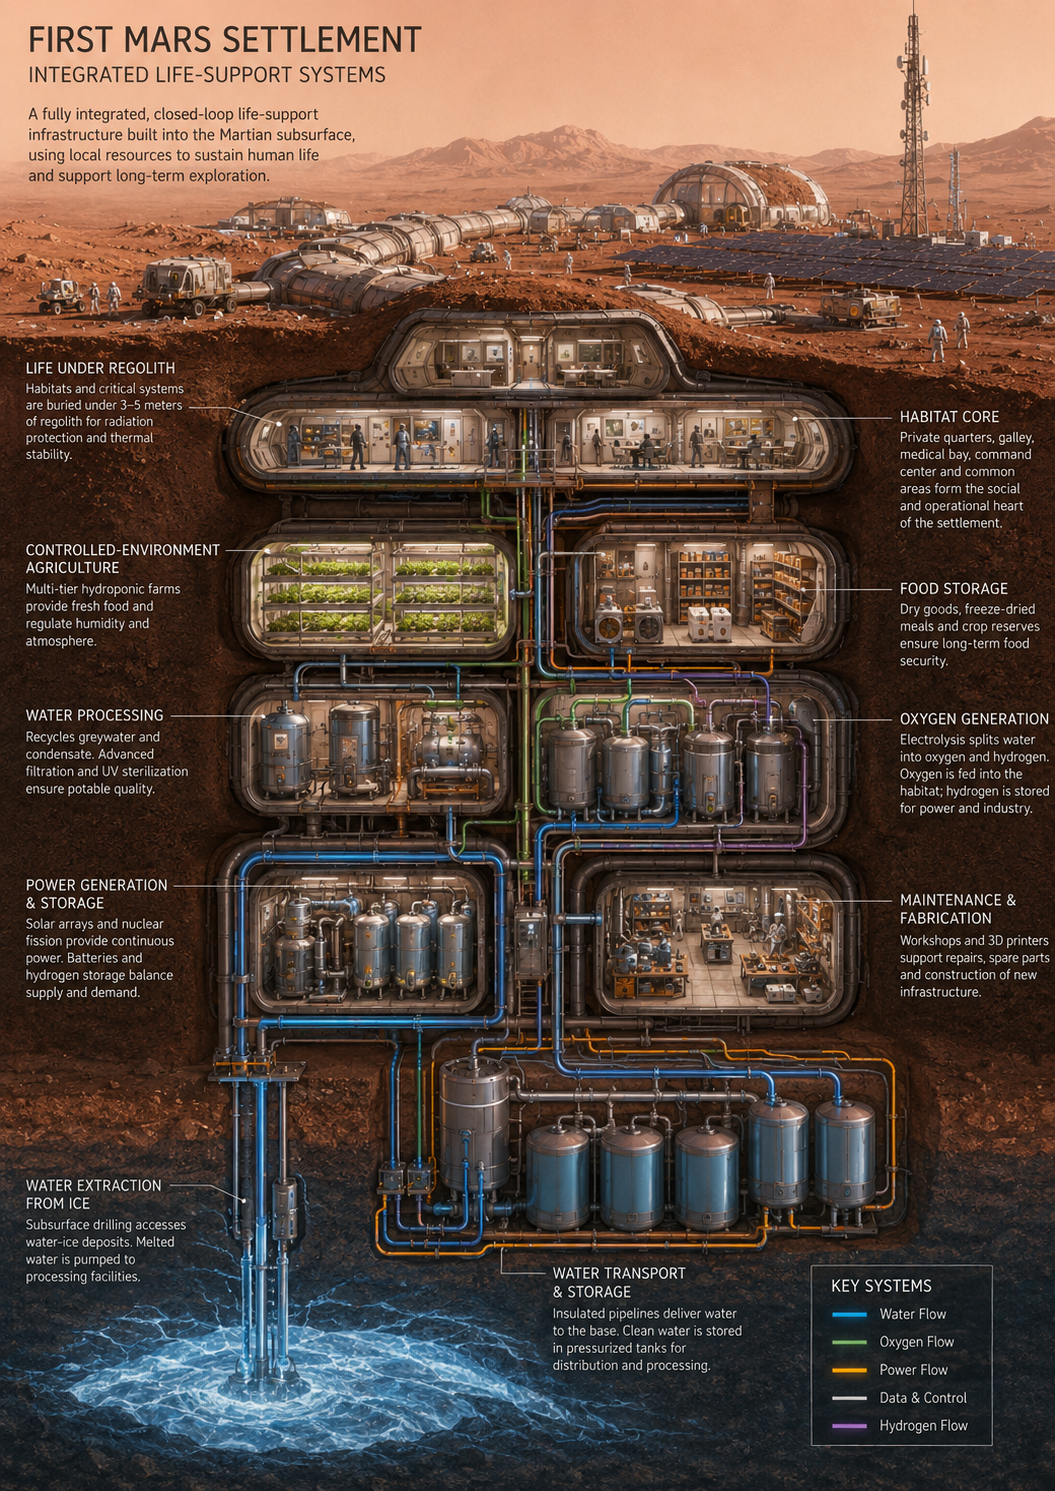
This lesson does not reuse one generic picture for every subject. The system view follows cause → measured quantity → decision or physical response → limit for “Water recovery: correctly understanding NASA’s 98% milestone”. The English text remains fully equivalent while large translated illustrations are intentionally deferred until their dedicated artwork is supplied. For “Water recovery: correctly understanding NASA’s 98% milestone”, the system view must expose inputs, outputs, measured quantity and the consequence of drift without relying on a generic module diagram.
4 — Mathematical relationship and reading the symbols
Read aloud : R equals recovered mass divided by mass entering the chosen boundary times one hundred; loss equals input times one minus recovery expressed as a fraction.
Before substituting numbers, write the unit of every term, state whether the relationship is a physical law, approximation or project indicator, and check dimensional consistency. This is especially important here because “Water recovery: correctly understanding NASA’s 98% milestone” combines quantities that do not all have the same evidence status. For “Water recovery: correctly understanding NASA’s 98% milestone”, this relationship is chosen because of the phenomenon under study; a different dominant quantity would require a different equation or model.
5 — Worked calculations and interpretation
1. 1. For 100 L
98% → 98 L recovered and 2 L unrecovered within the studied boundary
2. 2. Over 30 days
20 L/day × 30 days = 600 L processed; at 98%, mathematical loss = 12 L
3. 3. From 94 to 98%
over 1,000 L: losses are 60 L at 94% versus 20 L at 98%, avoiding 40 L of make-up in this example
6 — What the formula does not contain
The relationship “R = m_récupérée / m_entrée × 100 ; m_perdue = m_entrée × (1 − R)” does not by itself contain all of “Water recovery: correctly understanding NASA’s 98% milestone”. It does not automatically tell us whether a sensor is valid, a structure is aging, a resource is accessible, a command arrives in time or a secondary failure removes margin. The example 98% → 98 L recovered and 2 L unrecovered within the studied boundary therefore remains a local calculation rather than a complete architecture.
To make the model useful, explicitly add the quantities that dominate this subject: flows, conductivity, organic carbon, pressure, temperature, recovery fraction and storage volume. We can then ask which variation truly changes the result, which is negligible and which forces an architectural change. For “Water recovery: correctly understanding NASA’s 98% milestone”, this model limitation states exactly what a correct calculation still cannot establish about the real system.
7 — Instrumentation, observability and data quality
For “Water recovery: correctly understanding NASA’s 98% milestone”, observability relies on flows, conductivity, organic carbon, pressure, temperature, recovery fraction and storage volume. Each datum has a unit, acquisition rate, uncertainty, timestamp and validity domain. A value arriving without context can be more dangerous than no measurement because it creates unjustified confidence.
Consistency is checked with at least one independent piece of information when the function is critical. A trend, physical balance or second measurement principle helps distinguish a real system change from a drifting sensor. For “Water recovery: correctly understanding NASA’s 98% milestone”, the selected instrumentation must distinguish a real physical change from sensor drift or a bad state estimate.
8 — Phenomenon-specific failures and recovery
The reference failure is not a vague “broken component.” For “Water recovery: correctly understanding NASA’s 98% milestone”, test in particular membrane fouling, bad water-quality sensor, cross contamination or an undersized buffer tank. Diagnosis asks which symptoms appear first, which are only consequences and which action preserves the most options.
The degraded mode must be defined before failure: minimum function, allowable duration, consumed stock, crew action, abort condition and return-to-nominal criterion. That sequence is topic-specific and cannot be replaced by one universal paragraph about redundancy. For “Water recovery: correctly understanding NASA’s 98% milestone”, the degraded mode is defined around the minimum function specific to this subject, with an abort threshold and a return-to-nominal condition.
9 — NASA / reference case
The reference case is selected from ECLSS, NASA-STD-3001 or human-analog evidence according to the topic. The goal is not to copy the ISS onto Mars, but to identify what has been demonstrated, what is environment-dependent and what still requires qualification for a mission without rapid resupply.
The case is used only within what it actually demonstrates. Flight measurement, human-system standard, component test and architecture study are different kinds of evidence; the text therefore states what is observed, calculated, simulated or still prospective. For “Water recovery: correctly understanding NASA’s 98% milestone”, the cited NASA case is used as targeted evidence for this phenomenon and is never turned into one universal Mars architecture.
10 — Architecture trade
A good solution for “Water recovery: correctly understanding NASA’s 98% milestone” does not maximize one metric. Compare nominal performance, mass, energy, simplicity, maintenance, crew time, common dependencies and recoverability. An option that improves 20 L/day × 30 days = 600 L processed; at 98%, mathematical loss = 12 L can still be rejected if it makes failure detection or repair much harder.
The trade is recorded together with its assumptions. If environment data, mass or mission cadence changes, we know which conclusions must be recomputed instead of silently preserving an obsolete choice. For “Water recovery: correctly understanding NASA’s 98% milestone”, the trade is evaluated against the interfaces actually touched by this subject rather than a generic list of desirable qualities.
11 — Demonstration, testing and success criteria
The evidence strategy for “Water recovery: correctly understanding NASA’s 98% milestone” combines long-duration tests with representative waters, mass balances and microbiological/chemical analyses. Every test records exact hardware, software, configuration, environment, tolerances and success criterion. A successful demonstration outside the mission domain does not replace qualification inside it.
Evidence grows by levels: analytical relationship, simulation, component, subsystem, integrated system, duration and failure. This hierarchy prevents one spectacular test from being presented as validation of the whole mission. For “Water recovery: correctly understanding NASA’s 98% milestone”, demonstration must reproduce the constraints that make this phenomenon difficult; a spectacular test outside the mission domain is insufficient.
12 — Decision exercise
Situation: revisit “Water recovery: correctly understanding NASA’s 98% milestone” with a 20% increase in the most penalizing quantity from the first worked example while one measurement or backup path is unavailable.
13 — What to retain without over-generalizing
- Water recovery: correctly understanding NASA’s 98% milestone has its own observables and failure modes.
- The relationship R = m_récupérée / m_entrée × 100 ; m_perdue = m_entrée × (1 − R) remains attached to its units and boundary.
- NASA evidence is cited at the phenomenon level instead of reusing one reference bundle for an entire module.
14 — Topic-specific primary sources
These references directly document the phenomenon, technology or human constraint addressed in this lesson. They do not by themselves define an official Mars architecture. For “Water recovery: correctly understanding NASA’s 98% milestone”, the bibliography is deliberately targeted to this page so that readers can trace each claim back to the relevant primary document.