


Entry, descent and landing: remove energy without losing the vehicle
Manage the energy of atmospheric arrival
Starting question — Why does Mars entry, descent and landing become difficult long before touchdown?
Intuition. A vehicle arriving at planetary speed carries enormous kinetic energy. EDL must dissipate that energy while surviving heating, aerodynamic loads, uncertainty and a rapidly shrinking time-to-act.
- Explain the governing physical idea before calculating.
- Name every symbol and unit used in the key relation.
- Check the result with an independent inverse, bound or order-of-magnitude test.
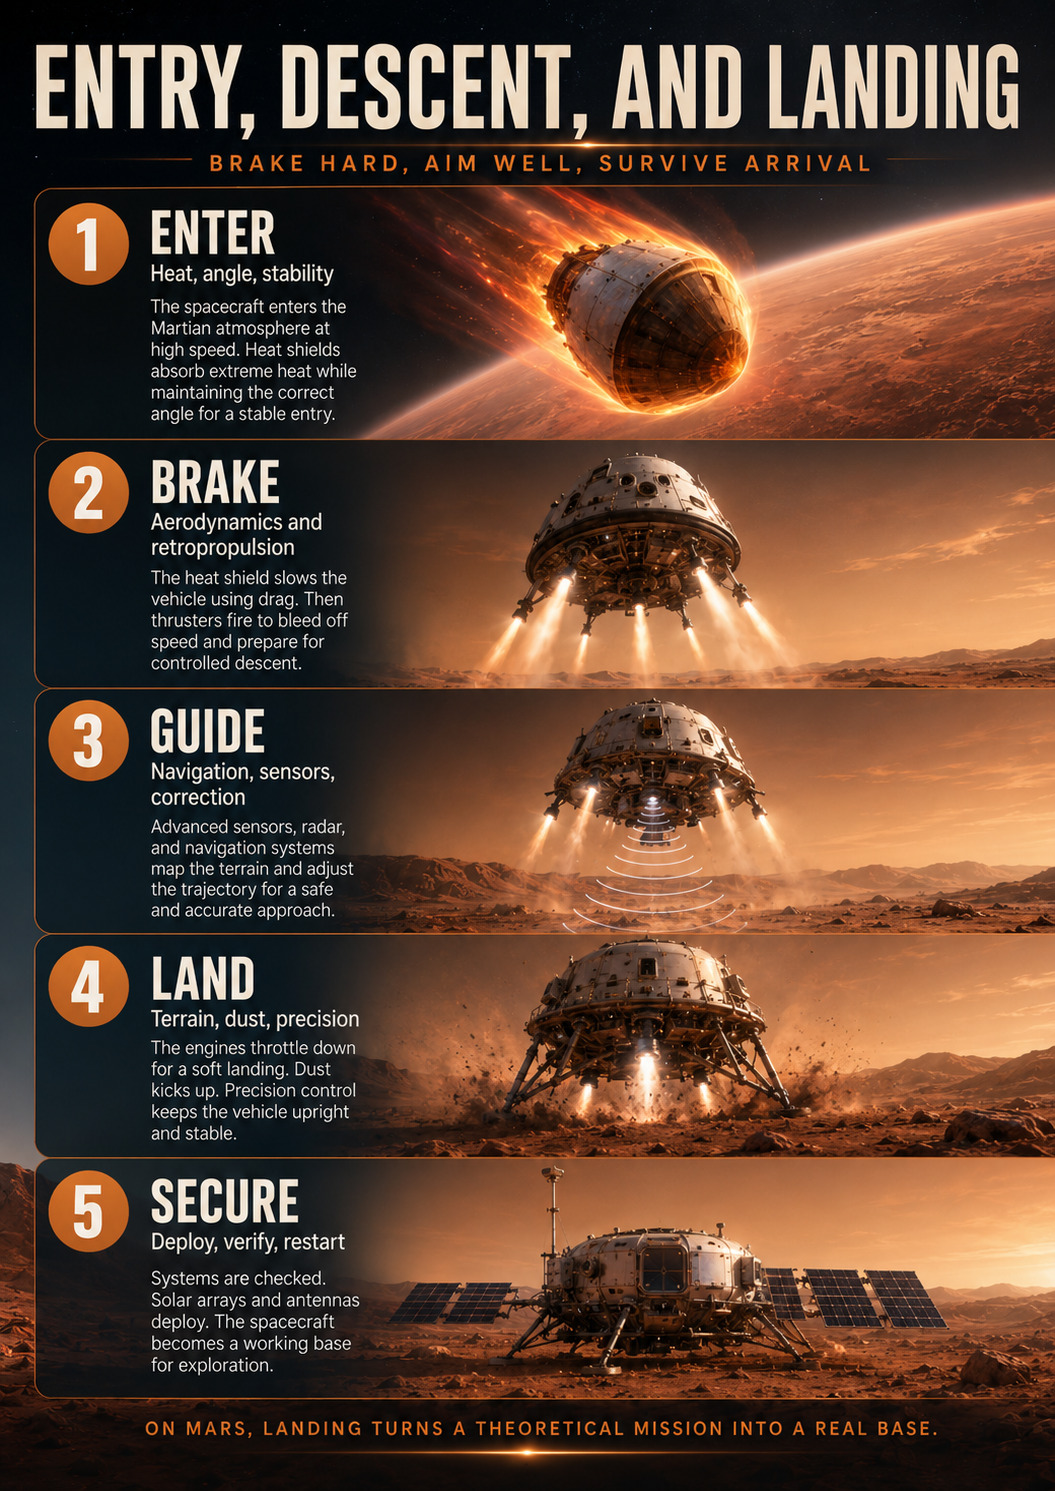
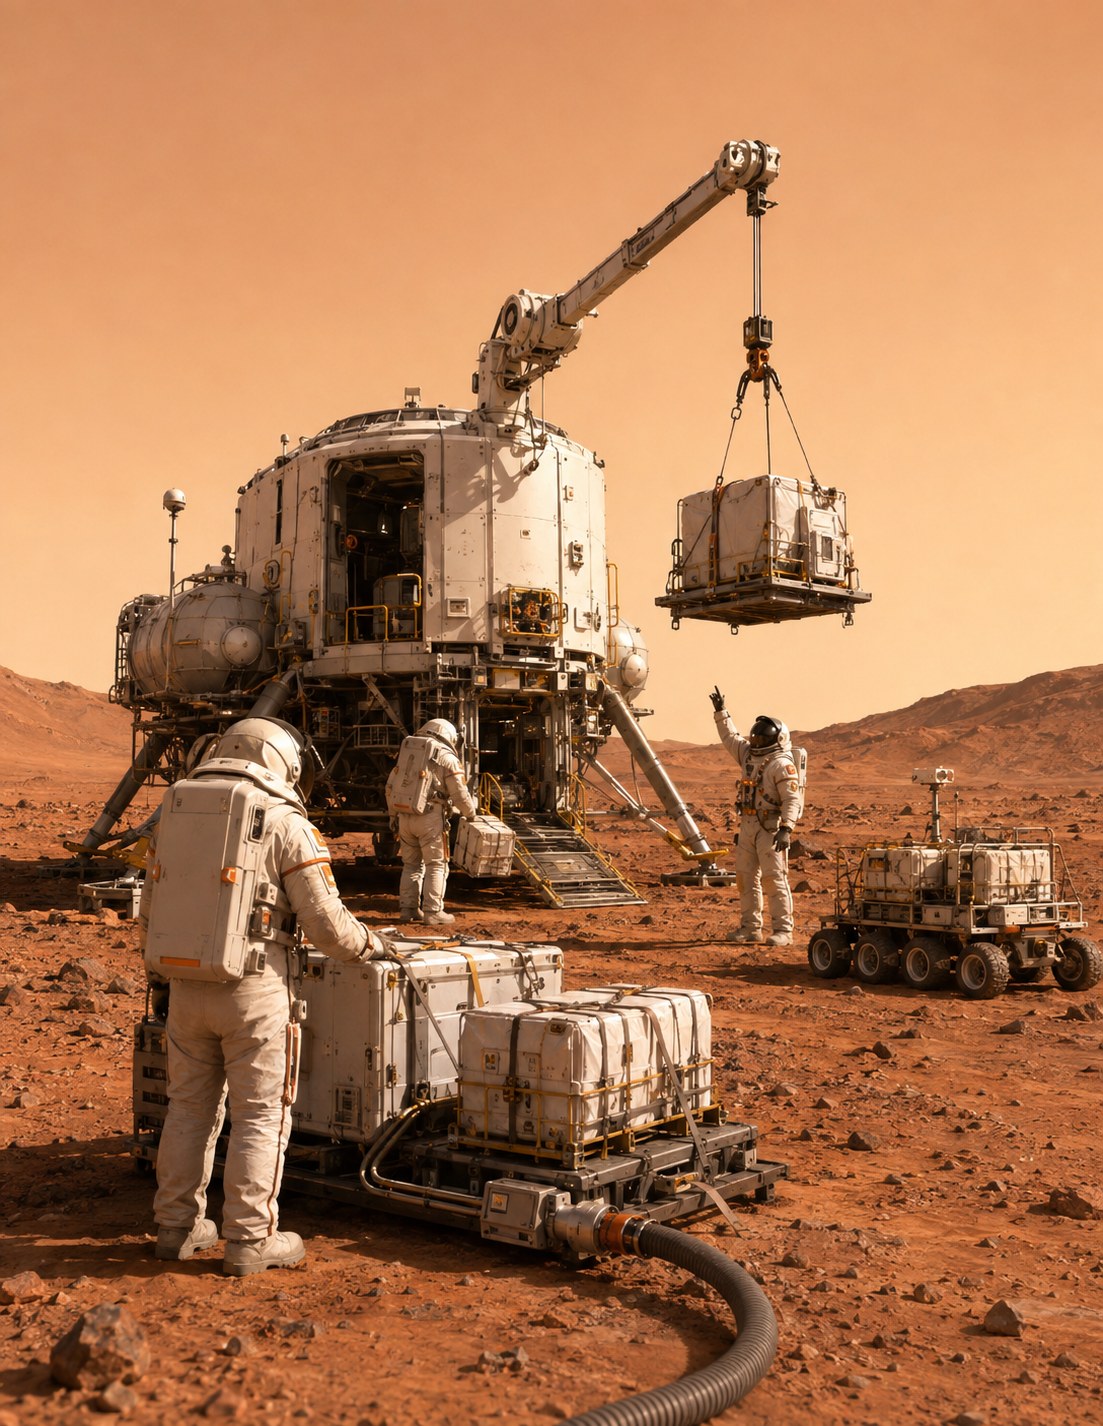
Entry, descent and landing compresses aerothermodynamics, structures, guidance, navigation, propulsion and surface interaction into minutes. Mars atmosphere helps remove energy but also creates heat; parachutes work only inside an envelope; engines must remove what remains; navigation must select a reachable safe site. This module follows energy and margins rather than memorising a sequence.
1. Start with kinetic energy
Kinetic energy is Ek = ½mv², with mass m in kilograms, velocity v in m/s and energy in joules. A 10,000 kg vehicle at 5,500 m/s carries about 1.51 × 10¹¹ J of kinetic energy. The squared velocity term explains why entry is fundamentally an energy-management problem.
EDL begins as an energy problem. Kinetic energy is E_k = ½mv², so doubling velocity multiplies energy by four. A 20,000 kg vehicle at 5,500 m/s carries roughly 0.5 × 20,000 × 5,500² ≈ 3.0 × 10¹¹ joules, nearly 300 gigajoules. Not all of that becomes heat in the shield, but the scale shows what atmosphere, lift, parachutes and engines must remove or redirect. EDL is therefore best read as an energy-closure chain: after each phase, how much velocity remains, how much altitude remains and which system still has authority to remove the next part safely?
2. The entry corridor is an allowable region, not one line
Too steep an entry can drive heating and deceleration high; too shallow a trajectory may fail to remove enough energy or depart the intended region. Guidance manages uncertainty in atmosphere and initial state while remaining within an admissible corridor.
The entry corridor is the set of states that avoids two broad failures. Too steep, and deceleration and heating become concentrated; too shallow, and the vehicle may fail to dissipate enough energy, overshoot the target or skip back out. The corridor is not just one angle. Mass, ballistic coefficient, atmospheric density, lift, navigation uncertainty and thermal limits all change it. Martian weather uncertainty and state-estimation error consume margin before the vehicle even enters. A meaningful review therefore asks how much corridor width remains after dispersion and how guidance uses attitude or lift to stay inside that region rather than drawing one perfect nominal line.
3. Dynamic pressure connects density and speed to load
q = ½ρv², where q is dynamic pressure in pascals, ρ density in kg/m³ and v speed in m/s. Mars is thin, but velocity squared is powerful. Dynamic pressure helps explain structural load and deployment windows.
Exercise A — dynamic pressure
Use ρ = 0.010 kg/m³ and v = 1,000 m/s. Compute q.
q = 0.5 × 0.010 × 1,000² = 5,000 Pa = 5 kPa. This is a teaching point, not a full atmospheric state.
Dynamic pressure is q = ½ρv², where ρ is atmospheric density in kg/m³ and v is relative speed in m/s. It explains why a very thin atmosphere can still produce significant aerodynamic loads at hypersonic speed: velocity enters squared. Peak aerodynamic load does not necessarily occur at peak heating. The vehicle therefore crosses several different constraints in sequence—temperature, dynamic pressure, deceleration, stability and targeting accuracy. Altitude alone is not enough to identify the regime; actual density and speed matter. Guidance combines measurement and model to determine which part of the envelope the vehicle is really occupying.
4. Thermal protection manages heat flux and integrated exposure
Entry heating depends on trajectory, velocity, density and shape. Ablative materials intentionally transform and carry energy away. Reusable systems tolerate and redistribute heating. Peak temperature alone does not describe the problem; heat flux, duration and internal gradients matter.
Thermal protection manages both instantaneous heat flux and integrated exposure. A sharp peak lasting seconds and a lower flux lasting minutes can create different material responses. Convective-heating correlations often depend very strongly on velocity, making the early hypersonic phase especially important. Ablative systems deliberately consume material to carry energy away; reusable systems rely more on storage, conduction and radiation. A Mars design also has to include seams, geometry, dust and atmospheric uncertainty. After peak heating, stored energy can continue migrating into structure, so the thermal problem does not end at the instant the external flux starts to fall.
5. Parachutes have a deployment envelope
Mach number, dynamic pressure, canopy size, mass and structural load constrain when a parachute can deploy. The thin Martian atmosphere limits what parachutes can do for high mass. Heavy EDL therefore needs multiple braking mechanisms.
A parachute cannot be deployed at arbitrary speed or dynamic pressure. Its envelope depends on Mach number, density, load, diameter and vehicle dynamics. Mars combines high remaining speed with low density, which limits how much a parachute can do for a human-scale heavy payload. Inflation is itself a severe transient involving opening load, oscillation and possible interaction with the vehicle. A heavy architecture may use a parachute to remove part of the energy without asking it to complete the entire landing. The useful performance metric is therefore the altitude and velocity delivered to the powered phase that follows.
6. Retropropulsion removes the remaining velocity
Powered descent supplies impulse when aerodynamic braking is insufficient. For a 20,000 kg lander on Mars, weight is roughly 20,000 × 3.71 = 74.2 kN. Total thrust of 120 kN gives thrust-to-weight about 1.62 before guidance and margin demands.
Retropropulsion must generate enough thrust early enough to remove remaining velocity while preserving guidance margin. A simple constant-deceleration estimate gives stopping distance d ≈ v²/(2a). At 300 m/s with 10 m/s² net deceleration, the scale is about 4,500 m, before gravity variation, ignition delay or throttle constraints. The calculation shows why a few lost seconds or reduced thrust can consume altitude quickly. Heavy landers also face engine interaction with supersonic flow and later with the ground. Available thrust therefore has to be studied together with navigation, gimbal authority, plume effects and propellant reserve.
7. Terrain-relative navigation connects onboard images to maps
TRN can compare descent imagery with stored mapping to refine position and avoid hazards. Map resolution, lighting, dust and surface texture remain limitations. A robust system tracks confidence and knows when the visual solution should not be trusted.
Terrain-relative navigation compares onboard images or ranging data with a stored map to estimate position relative to hazards and the target. It becomes valuable when inertial navigation alone leaves an uncertainty ellipse too wide for the landing zone. TRN still depends on map quality, illumination, surface texture, altitude and available computation. A region that looks safe in a coarse map may be inadequately characterised for a very large vehicle. The solution needs a confidence measure and fallback logic. Correcting position is only useful if the lander still has enough divert capability to act on that new information.
8. A divert is useful only inside the reachable set
A safe site outside remaining time, thrust or propellant is not a real option. As altitude falls, the reachable set contracts. Guidance needs to rank safety and reachability together rather than pick the visually best location in isolation.
A divert trades altitude, velocity, time and propellant for a safer site. The reachable set shrinks throughout descent. At higher altitude a correction can be cheap but terrain knowledge is poorer; near the ground imagery is better but lateral authority is limited. The algorithm therefore compares hazard severity, site value, reserve and time. The geologically best location is not necessarily the safest landing location. For a crewed vehicle, the safe set also includes slope, bearing strength, plume clearance, crew egress and distance to pre-positioned infrastructure. Reachability is a physical constraint, not merely a ranking score.
9. Engine plumes change the last metres
Near the ground, exhaust erodes regolith and accelerates particles. It can obscure sensors, contaminate hardware and alter soil supporting the lander. Heavy vehicles need plume–surface interaction included in site design and stability verification.
Engine plumes become a coupled ground–vehicle problem during the final seconds. Jets can excavate soil, accelerate particles and create clouds that degrade cameras or ranging sensors. Debris may return toward engines, landing gear or nearby assets. The effect depends on thrust, height, engine count, jet angle and regolith properties. Design therefore separates vulnerable equipment, chooses tolerant engine geometry and assumes optical visibility can deteriorate just before contact. Robotic landing data is essential evidence, but the thrust scale of a human lander requires explicit qualification of extrapolation rather than pretending the environments are identical.
10. Failure scenario: inconsistent altitude sensing
If one altimeter becomes inconsistent, the estimator compares inertial propagation, velocity, other measurements and expected dynamics. The allowed response changes with phase. Early in descent there may be manoeuvre time; late in descent aggressive reconfiguration can be more dangerous. FDIR therefore needs phase-aware confidence rules.
Inconsistent altitude sensing should not be solved by a simple average. Radar, lidar, inertial navigation and terrain-relative navigation may measure different quantities with different delays and geometries. FDIR compares each observation with vertical velocity, expected terrain and time history. If radar reports 800 m while lidar and terrain matching converge near 650 m, the decision depends on confidence and physical consistency, not just sensor count. The degraded mode must define which source may trigger ignition, how much extra altitude margin is required and when the vehicle should abandon an aggressive target in favour of a more conservative profile or site.
Guided case — altitude margin and ignition decision
Consider a lander descending at 250 m/s when powered descent becomes available. With an average net deceleration of 12 m/s², the ideal stopping distance v²/(2a) is about 2,604 m. Adding a two-second ignition delay consumes roughly another 500 m at first order, before including gravity and thrust buildup. The comparison shows why altitude sensing, command latency and engine-start transient belong to the same margin budget.
Students then add dispersion: actual net deceleration between 10 and 12 m/s² and estimated altitude with ±80 m uncertainty. Ignition should not be planned from the average if the conservative case fails to close. Margin comes from the combined uncertainty and from a decision altitude that still preserves a fallback.
Finally, a hazardous patch is detected after ignition. Divert is accepted only if lateral reserve does not destroy vertical closure. EDL becomes a simultaneous trade among terrain safety, remaining velocity, altitude and propellant rather than a sequence of independent subsystems.
11. Mini-project: close an EDL chain
- Choose teaching values for entry mass and speed.
- Compute kinetic energy.
- Assign energy removal to atmosphere, parachute and propulsion qualitatively.
- List navigation measurements.
- Add a hazard and divert.
- Remove one sensor in terminal descent.
- State success criteria after touchdown.
The answer should trace energy, state knowledge and control margin to the surface.
12. Mission lab — track energy closure through powered descent
Take a teaching vehicle of 20,000 kg entering powered descent at 250 m/s. Its kinetic energy is E = ½mv² = 0.5 × 20,000 × 250² = 625 MJ. Propulsion must remove this motion while also supporting gravity and preserving guidance authority. Energy does not directly give propellant mass because the engine acts through thrust, exhaust velocity and trajectory, but it provides a powerful scale check.
Altitude and time must close at the same time. If vertical speed were 50 m/s for ten seconds, the simple displacement scale would be Δh = v × Δt = 500 m. Real descent is accelerated and guided, yet this mental check immediately reveals whether a proposed sensor delay or manoeuvre can fit inside remaining altitude.
Margin is temporal as well as propulsive. A late hazard detection can leave substantial propellant but insufficient time to move laterally, settle the new trajectory and verify the landing point. Terminal displays therefore need state, confidence, thrust reserve and the remaining reachable set—not just a green/red hazard flag.
Another useful check is thrust-to-weight. If the same 20,000 kg lander has 120 kN total thrust, Mars weight is about 74.2 kN and the ratio is about 1.62. Part of that authority supports the vehicle against gravity; the remainder must provide deceleration and lateral control. Engine-out cases should recompute the ratio rather than assume “multiple engines” guarantees control.
13. Limits of robotic evidence for a heavy human lander
Robotic Mars missions provide extraordinary evidence for navigation, thermal protection, parachutes and surface operations. They do not automatically qualify a vehicle tens of tonnes in mass. Physics scales continuously, but propulsion geometry, plume interaction, structural energy and consequence of error change.
A mature evidence ladder distinguishes what has flown on Mars, what has been demonstrated in representative Earth testing, what has been simulated with validated models and what remains an architecture concept. This prevents a technology success from being silently promoted into proof of a much larger integrated system.
For a design review, identify the largest scale jump in each subsystem: heat shield, parachute or other decelerator, engines, landing gear, TRN, plume interaction and site infrastructure. Then ask what test or flight closes that gap. The unanswered questions become a development roadmap rather than hidden uncertainty.
Calculation laboratory — formula reasoning
Entry, descent and landing: quantitative mini-lessons
Entry kinetic energy
- 1 — Concrete question
- What does “E_k = 1/2 × m × v²” compute in the context of “Entry kinetic energy”?
- 2 — Intuition without symbols
- Speed enters squared: at fixed mass, doubling speed quadruples kinetic energy.
- 3 — Quantities
- E_k: kinetic energy; m: mass; v: speed.
- 4 — Formula
- E_k = 1/2 × m × v²
- 5 — Read aloud
- Read “E_k = 1/2 × m × v²” by naming every operation explicitly.
- 6 — Symbols and meaning
- E_k: kinetic energy; m: mass; v: speed.
- 7 — Pronunciation
- The “Read aloud” line above is the oral reference for “Entry kinetic energy”. Any subscript, exponent or grouping that changes the meaning of the relation should be spoken explicitly.
- 8 — Units
- E_k in J; m in kg; v in m/s.
- 9 — Convention
- For “Entry kinetic energy”, substitute values without changing the reference frame, time basis, system boundary or sign convention halfway through the calculation. Stated units: E_k in J; m in kg; v in m/s.
- 10 — Why this operation
- Classical mechanics gives translational energy as one half mass times speed squared.
- 11 — Assumptions
- Regime where classical formula is sufficient and speed is defined in the chosen frame.
- 12 — Unit check
- E_k in J; m in kg; v in m/s. Verify that units reduce to the announced output quantity.
- 13 — Numerical case
- With m = 20,000 kg and v = 5,500 m/s, E_k = 0.5×20,000×5,500² = 3.025×10¹¹ J.
- 14 — Why the calculation works
- Classical mechanics gives translational energy as one half mass times speed squared.
- 15 — Algebraic check
- v = √(2E_k/m) must recover 5,500 m/s.
- 16 — Mental estimate
- 5.5 km/s squared is about 30 million; times 10,000 gives about 3×10¹¹ J.
- 17 — Interpretation
- This energy must be dissipated or redirected during EDL without exceeding thermal and structural limits.
- 18 — What the result does not prove
- For “Entry kinetic energy”, the number obtained answers only the model “E_k = 1/2 × m × v²” under the stated scenario. It does not by itself validate the input data or the model outside those conditions.
- 19 — Sensitivity
- At fixed mass, +10% speed produces about +21% energy.
- 20 — Guided and autonomous exercises
Guided exercise. m = 4,000 kg and v = 5,500 m/s.
Detailed guided correction — open after trying
E_k = 0.5×4,000×5,500² = 6.05×10¹⁰ J.
Autonomous exercise. m = 10,000 kg and v = 250 m/s.
Autonomous correction — open after trying
E_k = 0.5×10,000×250² = 3.125×10⁸ J = 312.5 MJ.
- 21 — Mission decision
- Size the EDL sequence around energy, not only instantaneous speed.
Dynamic pressure
- 1 — Concrete question
- What does “q = 1/2 × ρ × v²” compute in the context of “Dynamic pressure”?
- 2 — Intuition without symbols
- Even in a thin atmosphere, high speed can produce significant aerodynamic load because speed enters squared.
- 3 — Quantities
- q: dynamic pressure; ρ: atmospheric density; v: relative speed.
- 4 — Formula
- q = 1/2 × ρ × v²
- 5 — Read aloud
- Read “q = 1/2 × ρ × v²” by naming every operation explicitly.
- 6 — Symbols and meaning
- q: dynamic pressure; ρ: atmospheric density; v: relative speed.
- 7 — Pronunciation
- The “Read aloud” line above is the oral reference for “Dynamic pressure”. Any subscript, exponent or grouping that changes the meaning of the relation should be spoken explicitly.
- 8 — Units
- q in Pa; ρ in kg/m³; v in m/s.
- 9 — Convention
- For “Dynamic pressure”, substitute values without changing the reference frame, time basis, system boundary or sign convention halfway through the calculation. Stated units: q in Pa; ρ in kg/m³; v in m/s.
- 10 — Why this operation
- Dynamic pressure represents the load scale associated with incident airflow.
- 11 — Assumptions
- Density and relative speed taken at the same trajectory point.
- 12 — Unit check
- q in Pa; ρ in kg/m³; v in m/s. Verify that units reduce to the announced output quantity.
- 13 — Numerical case
- With ρ = 0.010 kg/m³ and v = 1,000 m/s, q = 0.5×0.010×1,000² = 5,000 Pa = 5 kPa.
- 14 — Why the calculation works
- Dynamic pressure represents the load scale associated with incident airflow.
- 15 — Algebraic check
- 2q/(v²) must recover ρ.
- 16 — Mental estimate
- 0.005 times one million gives 5,000 Pa.
- 17 — Interpretation
- q helps define deployment windows and loads but does not replace a full aerodynamic model.
- 18 — What the result does not prove
- For “Dynamic pressure”, the number obtained answers only the model “q = 1/2 × ρ × v²” under the stated scenario. It does not by itself validate the input data or the model outside those conditions.
- 19 — Sensitivity
- At fixed density, +10% speed increases q by about 21%.
- 20 — Guided and autonomous exercises
Guided exercise. ρ = 0.015 kg/m³ and v = 800 m/s.
Detailed guided correction — open after trying
q = 0.5×0.015×800² = 4,800 Pa.
Autonomous exercise. ρ = 0.008 kg/m³ and v = 1,200 m/s.
Autonomous correction — open after trying
q = 0.5×0.008×1,200² = 5,760 Pa.
- 21 — Mission decision
- Trigger EDL events using actual atmospheric state and qualified load margins.
Vehicle weight on Mars
- 1 — Concrete question
- What does “W = m × g_Mars” compute in the context of “Vehicle weight on Mars”?
- 2 — Intuition without symbols
- Weight is local gravitational force: the same mass weighs less on Mars than on Earth.
- 3 — Quantities
- W: weight; m: mass; g_Mars: first-order local Martian gravitational acceleration.
- 4 — Formula
- W = m × g_Mars
- 5 — Read aloud
- Read “W = m × g_Mars” by naming every operation explicitly.
- 6 — Symbols and meaning
- W: weight; m: mass; g_Mars: first-order local Martian gravitational acceleration.
- 7 — Pronunciation
- The “Read aloud” line above is the oral reference for “Vehicle weight on Mars”. Any subscript, exponent or grouping that changes the meaning of the relation should be spoken explicitly.
- 8 — Units
- W in N; m in kg; g in m/s².
- 9 — Convention
- For “Vehicle weight on Mars”, substitute values without changing the reference frame, time basis, system boundary or sign convention halfway through the calculation. Stated units: W in N; m in kg; g in m/s².
- 10 — Why this operation
- Mass under gravitational acceleration produces force m·g.
- 11 — Assumptions
- g_Mars ≈ 3.71 m/s² used as a teaching average.
- 12 — Unit check
- W in N; m in kg; g in m/s². Verify that units reduce to the announced output quantity.
- 13 — Numerical case
- For m = 20,000 kg, W = 20,000×3.71 = 74,200 N = 74.2 kN.
- 14 — Why the calculation works
- Mass under gravitational acceleration produces force m·g.
- 15 — Algebraic check
- W/m must recover 3.71 m/s².
- 16 — Mental estimate
- 20 tonnes times about 3.7 gives about 74 kN.
- 17 — Interpretation
- Weight sets a minimum thrust merely to support the vehicle in ideal hover.
- 18 — What the result does not prove
- For “Vehicle weight on Mars”, the number obtained answers only the model “W = m × g_Mars” under the stated scenario. It does not by itself validate the input data or the model outside those conditions.
- 19 — Sensitivity
- At fixed g, W varies linearly with mass.
- 20 — Guided and autonomous exercises
Guided exercise. m = 15,000 kg.
Detailed guided correction — open after trying
W = 15,000×3.71 = 55,650 N = 55.65 kN.
Autonomous exercise. m = 8,000 kg.
Autonomous correction — open after trying
W = 8,000×3.71 = 29,680 N = 29.68 kN.
- 21 — Mission decision
- Keep thrust margin above weight for guidance and deceleration.
Stopping distance at constant deceleration
- 1 — Concrete question
- What does “d_stop ≈ v² / (2a)” compute in the context of “Stopping distance at constant deceleration”?
- 2 — Intuition without symbols
- High speed requires substantial distance to remove; distance grows with speed squared.
- 3 — Quantities
- d_stop: distance; v: initial speed; a: magnitude of assumed constant net deceleration.
- 4 — Formula
- d_stop ≈ v² / (2a)
- 5 — Read aloud
- Read “d_stop ≈ v² / (2a)” by naming every operation explicitly.
- 6 — Symbols and meaning
- d_stop: distance; v: initial speed; a: magnitude of assumed constant net deceleration.
- 7 — Pronunciation
- The “Read aloud” line above is the oral reference for “Stopping distance at constant deceleration”. Any subscript, exponent or grouping that changes the meaning of the relation should be spoken explicitly.
- 8 — Units
- d in m; v in m/s; a in m/s².
- 9 — Convention
- For “Stopping distance at constant deceleration”, substitute values without changing the reference frame, time basis, system boundary or sign convention halfway through the calculation. Stated units: d in m; v in m/s; a in m/s².
- 10 — Why this operation
- Kinematic relation v_f² = v_i² − 2ad with v_f = 0 leads to d = v²/(2a).
- 11 — Assumptions
- Constant deceleration and one-dimensional motion.
- 12 — Unit check
- d in m; v in m/s; a in m/s². Verify that units reduce to the announced output quantity.
- 13 — Numerical case
- At v = 300 m/s and a = 10 m/s², d = 300²/20 = 4,500 m.
- 14 — Why the calculation works
- Kinematic relation v_f² = v_i² − 2ad with v_f = 0 leads to d = v²/(2a).
- 15 — Algebraic check
- 2ad must recover v² = 90,000 m²/s².
- 16 — Mental estimate
- 300² is 90,000; dividing by 20 gives 4,500 m.
- 17 — Interpretation
- The result gives a minimum braking scale, not a complete powered-descent trajectory.
- 18 — What the result does not prove
- For “Stopping distance at constant deceleration”, the number obtained answers only the model “d_stop ≈ v² / (2a)” under the stated scenario. It does not by itself validate the input data or the model outside those conditions.
- 19 — Sensitivity
- At fixed a, +10% speed increases d by about 21%.
- 20 — Guided and autonomous exercises
Guided exercise. v = 250 m/s and a = 8 m/s².
Detailed guided correction — open after trying
d = 62,500/16 = 3,906.25 m.
Autonomous exercise. v = 200 m/s and a = 5 m/s².
Autonomous correction — open after trying
d = 40,000/10 = 4,000 m.
- 21 — Mission decision
- Start powered descent with enough altitude to absorb dispersion and margin.
First-order vertical displacement
- 1 — Concrete question
- What does “Δh ≈ v_vertical × Δt” compute in the context of “First-order vertical displacement”?
- 2 — Intuition without symbols
- Over a short interval, average vertical speed immediately gives the scale of altitude change.
- 3 — Quantities
- Δh: altitude change; v_vertical: average vertical speed; Δt: duration.
- 4 — Formula
- Δh ≈ v_vertical × Δt
- 5 — Read aloud
- Read “Δh ≈ v_vertical × Δt” by naming every operation explicitly.
- 6 — Symbols and meaning
- Δh: altitude change; v_vertical: average vertical speed; Δt: duration.
- 7 — Pronunciation
- The “Read aloud” line above is the oral reference for “First-order vertical displacement”. Any subscript, exponent or grouping that changes the meaning of the relation should be spoken explicitly.
- 8 — Units
- Δh in m; v in m/s; t in s.
- 9 — Convention
- For “First-order vertical displacement”, substitute values without changing the reference frame, time basis, system boundary or sign convention halfway through the calculation. Stated units: Δh in m; v in m/s; t in s.
- 10 — Why this operation
- Distance equals average speed times duration.
- 11 — Assumptions
- Representative average speed; vertical sign convention declared.
- 12 — Unit check
- Δh in m; v in m/s; t in s. Verify that units reduce to the announced output quantity.
- 13 — Numerical case
- With v_vertical = 50 m/s for 10 s, |Δh| ≈ 50×10 = 500 m.
- 14 — Why the calculation works
- Distance equals average speed times duration.
- 15 — Algebraic check
- |Δh|/Δt must recover 50 m/s.
- 16 — Mental estimate
- Fifty metres per second for ten seconds gives five hundred metres.
- 17 — Interpretation
- This mental check can expose an EDL timeline incompatible with remaining altitude.
- 18 — What the result does not prove
- For “First-order vertical displacement”, the number obtained answers only the model “Δh ≈ v_vertical × Δt” under the stated scenario. It does not by itself validate the input data or the model outside those conditions.
- 19 — Sensitivity
- At fixed average speed, displacement varies linearly with duration.
- 20 — Guided and autonomous exercises
Guided exercise. 40 m/s for 12 s.
Detailed guided correction — open after trying
|Δh| ≈ 40×12 = 480 m.
Autonomous exercise. 25 m/s for 20 s.
Autonomous correction — open after trying
|Δh| ≈ 25×20 = 500 m.
- 21 — Mission decision
- Compare this scale with available altitude before each critical event.
Ballistic coefficient
- 1 — Concrete question
- What does “β = m / (C_d × A)” compute in the context of “Ballistic coefficient”?
- 2 — Intuition without symbols
- Ballistic coefficient compares mass with aerodynamic braking capacity from area and drag; a higher value generally means more inertia per braking area.
- 3 — Quantities
- β: ballistic coefficient; m: mass; C_d: drag coefficient; A: reference area.
- 4 — Formula
- β = m / (C_d × A)
- 5 — Read aloud
- Read “β = m / (C_d × A)” by naming every operation explicitly.
- 6 — Symbols and meaning
- β: ballistic coefficient; m: mass; C_d: drag coefficient; A: reference area.
- 7 — Pronunciation
- The “Read aloud” line above is the oral reference for “Ballistic coefficient”. Any subscript, exponent or grouping that changes the meaning of the relation should be spoken explicitly.
- 8 — Units
- β in kg/m²; m in kg; C_d dimensionless; A in m².
- 9 — Convention
- For “Ballistic coefficient”, substitute values without changing the reference frame, time basis, system boundary or sign convention halfway through the calculation. Stated units: β in kg/m²; m in kg; C_d dimensionless; A in m².
- 10 — Why this operation
- Denominator combines geometric aerodynamic effectiveness; mass in numerator represents inertia to slow.
- 11 — Assumptions
- C_d and A defined under the same aerodynamic convention.
- 12 — Unit check
- β in kg/m²; m in kg; C_d dimensionless; A in m². Verify that units reduce to the announced output quantity.
- 13 — Numerical case
- With m = 4,000 kg, C_d = 1.5 and A = 15 m², β = 4,000/22.5 = 177.78 kg/m².
- 14 — Why the calculation works
- Denominator combines geometric aerodynamic effectiveness; mass in numerator represents inertia to slow.
- 15 — Algebraic check
- βC_dA must recover mass.
- 16 — Mental estimate
- 4,000 divided by a little over 20 gives a little under 200 kg/m².
- 17 — Interpretation
- β helps explain aerodynamic deceleration, but trajectory also depends on density, speed and lift.
- 18 — What the result does not prove
- For “Ballistic coefficient”, the number obtained answers only the model “β = m / (C_d × A)” under the stated scenario. It does not by itself validate the input data or the model outside those conditions.
- 19 — Sensitivity
- Increasing mass raises β; increasing C_d or A lowers it.
- 20 — Guided and autonomous exercises
Guided exercise. m = 5,000 kg, C_d = 1.6, A = 18 m².
Detailed guided correction — open after trying
β = 5,000/(1.6×18) = 173.61 kg/m².
Autonomous exercise. m = 3,500 kg, C_d = 1.4, A = 12 m².
Autonomous correction — open after trying
β = 3,500/16.8 = 208.33 kg/m².
- 21 — Mission decision
- Use β with qualified atmosphere and aerodynamics before freezing the EDL window.
Mission reasoning lab — quantify what entry must dissipate
Scenario. Consider a 4,000-kg vehicle entering at 5,500 m/s. Classical translational kinetic energy is ½×4,000×5,500² ≈ 6.05×10¹⁰ J, about 60 GJ. This is not a prediction of heat-shield energy absorption: some energy changes atmospheric motion, some changes potential energy and vehicle motion, and the detailed trajectory matters. The calculation is an order-of-magnitude statement of the enormous energy that entry must manage.
1. Speed dominates the energy scale
If entry speed were 10% higher at the same mass, kinetic energy would be about 21% higher because of the square. That sensitivity is why navigation, arrival geometry and trajectory design strongly affect EDL loads. Treating energy as proportional to speed would badly understate the consequence of faster arrival.
2. Separate heat flux from total heat load
Heat flux measures thermal power per unit area, such as W/m². Total heat load integrates flux over time. A very high short peak and a lower but prolonged heating pulse can produce different material responses. Thermal protection therefore depends on both peak conditions and integrated exposure.
3. Drag is both useful and dangerous
Mars’s atmosphere provides free braking mass, but it is thin and variable. Greater drag can remove velocity faster, yet it can also raise deceleration loads and alter heating. A viable entry corridor balances enough atmospheric interaction to slow down against limits on heating, structural load and skip-out risk.
4. Corridor reasoning
A trajectory that is too steep can drive large deceleration and heating; one that is too shallow can fail to descend enough or can skip back upward. The corridor is not a single angle: mass, ballistic coefficient, lift, atmospheric density, winds, navigation error and landing-site geometry all influence what remains feasible.
5. Inverse problem — allowable speed for an energy cap
If an analysis imposed a notional kinetic-energy cap of 4.0×10¹⁰ J for a 4,000-kg vehicle, the corresponding speed from v = √(2E/m) would be √(8.0×10¹⁰/4,000) ≈ 4,472 m/s. This inverse calculation does not set an actual TPS requirement; it demonstrates how an energy limit translates into a speed scale.
6. Do not call ½ a variable denominator
The factor one-half is a fixed constant. The safe calculation order is v², then m×v², then divide by 2. The inverse formula v = √(2E/m) should recover the original speed. This explicit sequence prevents confusing the fixed factor one-half with the quotient structure when the equation is rearranged.
Decision check
Before accepting an EDL calculation, verify mass at entry, inertial and atmosphere-relative velocity definitions, atmospheric model, heating metric, structural-load limits, guidance authority, navigation uncertainty and terminal-descent handover conditions. A single kinetic-energy number is a starting scale, not an EDL design.
Zero-prerequisite concepts
kinetic energy
Definition. Kinetic energy is energy associated with motion. In the classical translational case, E_k = ½mv².
Example. A Mars entry vehicle carries immense kinetic energy before the atmosphere begins to slow it.
Pitfall. Because speed is squared, a modest speed increase can create a large energy increase.
Doubling speed at fixed mass must quadruple kinetic energy.
Guided exercise — kinetic energy
Situation to recognize. Kinetic energy is energy associated with motion. In the classical translational case, E_k = ½mv².
Check requested. Doubling speed at fixed mass must quadruple kinetic energy.
Error to reject. Because speed is squared, a modest speed increase can create a large energy increase.
Reasoned solution
- Precise meaning
- Kinetic energy is energy associated with motion. In the classical translational case, E_k = ½mv².
- Case test
- Doubling speed at fixed mass must quadruple kinetic energy.
- Excluded pitfall
- Because speed is squared, a modest speed increase can create a large energy increase.
- Operational consequence
- Use this check before accepting a result in mission design: Doubling speed at fixed mass must quadruple kinetic energy.
- Quantification
- kinetic energy: use the unit or dimension defined by the physical quantity; if the concept is qualitative, do not invent a numerical unit.
- Verification
- kinetic energy: compare the conclusion with the mental check and the stated pitfall.
drag
Definition. Aerodynamic drag is the force component opposing motion through a fluid, here the Martian atmosphere.
Example. A heat shield uses atmospheric drag to reduce vehicle speed during entry.
Pitfall. More drag is not always better: high drag can also increase loads, instability and heating conditions.
At similar conditions, greater atmospheric density or reference area tends to increase drag magnitude.
Guided exercise — drag
Situation to recognize. Aerodynamic drag is the force component opposing motion through a fluid, here the Martian atmosphere.
Check requested. At similar conditions, greater atmospheric density or reference area tends to increase drag magnitude.
Error to reject. More drag is not always better: high drag can also increase loads, instability and heating conditions.
Reasoned solution
- Precise meaning
- Aerodynamic drag is the force component opposing motion through a fluid, here the Martian atmosphere.
- Case test
- At similar conditions, greater atmospheric density or reference area tends to increase drag magnitude.
- Excluded pitfall
- More drag is not always better: high drag can also increase loads, instability and heating conditions.
- Operational consequence
- Use this check before accepting a result in mission design: At similar conditions, greater atmospheric density or reference area tends to increase drag magnitude.
- Quantification
- drag: use the unit or dimension defined by the physical quantity; if the concept is qualitative, do not invent a numerical unit.
- Verification
- drag: compare the conclusion with the mental check and the stated pitfall.
heat flux
Definition. Heat flux is thermal power transferred per unit area, commonly expressed in W/m².
Example. Entry heating concentrates severe thermal loads near the heat-shield surface.
Pitfall. Heat flux is not the same as total heat load; duration matters for accumulated energy.
A short high peak and a long lower flux can produce different material responses even if one peak value matches.
Guided exercise — heat flux
Situation to recognize. Heat flux is thermal power transferred per unit area, commonly expressed in W/m².
Check requested. A short high peak and a long lower flux can produce different material responses even if one peak value matches.
Error to reject. Heat flux is not the same as total heat load; duration matters for accumulated energy.
Reasoned solution
- Precise meaning
- Heat flux is thermal power transferred per unit area, commonly expressed in W/m².
- Case test
- A short high peak and a long lower flux can produce different material responses even if one peak value matches.
- Excluded pitfall
- Heat flux is not the same as total heat load; duration matters for accumulated energy.
- Operational consequence
- Use this check before accepting a result in mission design: A short high peak and a long lower flux can produce different material responses even if one peak value matches.
- Quantification
- heat flux: use the unit or dimension defined by the physical quantity; if the concept is qualitative, do not invent a numerical unit.
- Verification
- heat flux: compare the conclusion with the mental check and the stated pitfall.
entry corridor
Definition. An entry corridor is the range of atmospheric-entry states that can satisfy constraints such as heating, loads, skip-out and landing accuracy.
Example. Too steep an entry can create excessive loads and heating; too shallow an entry can skip or miss the target.
Pitfall. The corridor is multidimensional, not only a single flight-path angle.
Increasing one constraint margin can reduce another, so a valid design must satisfy all corridor boundaries simultaneously.
Guided exercise — entry corridor
Situation to recognize. An entry corridor is the range of atmospheric-entry states that can satisfy constraints such as heating, loads, skip-out and landing accuracy.
Check requested. Increasing one constraint margin can reduce another, so a valid design must satisfy all corridor boundaries simultaneously.
Error to reject. The corridor is multidimensional, not only a single flight-path angle.
Reasoned solution
- Precise meaning
- An entry corridor is the range of atmospheric-entry states that can satisfy constraints such as heating, loads, skip-out and landing accuracy.
- Case test
- Increasing one constraint margin can reduce another, so a valid design must satisfy all corridor boundaries simultaneously.
- Excluded pitfall
- The corridor is multidimensional, not only a single flight-path angle.
- Operational consequence
- Use this check before accepting a result in mission design: Increasing one constraint margin can reduce another, so a valid design must satisfy all corridor boundaries simultaneously.
- Quantification
- entry corridor: use the unit or dimension defined by the physical quantity; if the concept is qualitative, do not invent a numerical unit.
- Verification
- entry corridor: compare the conclusion with the mental check and the stated pitfall.
Beginner vocabulary checkpoint
- entry interface — Defined atmospheric condition or altitude used as the starting boundary for entry analysis.
- ballistic coefficient — Combination of mass, drag coefficient and reference area that influences deceleration through an atmosphere.
- lift-to-drag ratio — Aerodynamic lift divided by drag; it affects controllability and cross-range during entry.
- heat flux — Rate of thermal energy arriving per unit area of the heat shield.
- heat shield — Thermal protection system that limits heating of the vehicle during atmospheric entry.
- ablation — Controlled removal of thermal-protection material that carries heat away.
- deceleration — Reduction in vehicle speed; during entry it produces loads on structure and occupants.
- parachute — Deployable aerodynamic decelerator used in atmospheric descent where conditions permit.
- supersonic — Flight at a speed greater than the local speed of sound.
- terminal descent — Final descent phase immediately before touchdown.
- terrain-relative navigation — Navigation that compares sensed terrain with onboard maps to estimate position and improve landing accuracy.
- hazard avoidance — Detection and rejection of unsafe landing areas such as slopes, rocks or craters.
- landing ellipse — Region on the surface within which a landing is statistically expected to occur.
- kinetic energy — Energy of motion equal to one half mass times speed squared.
- atmospheric density — Mass of atmosphere per unit volume; it strongly affects drag and heating.
- dynamic pressure — One half density times speed squared; a key indicator of aerodynamic loading.
- bank angle — Rotation of the lift vector around the velocity direction, used to steer a lifting entry.
- powered descent — Descent phase in which engines provide controlled braking and landing thrust.
Sources and references
Verified primary supplement: NASA NTRS — Rocket Plume Interactions for NASA Landing Systems
Engineering studio — propagate an EDL dispersion
The case imposes both atmospheric density 15% below prediction and vehicle mass 2% above prediction. Ballistic coefficient β = m/(Cd·A) therefore rises at least with mass, while dynamic pressure q = ½ρv² falls directly with density at equal speed. The student explains the consequence: aerodynamic deceleration develops differently and more energy may reach the propulsive phases.
The exercise then propagates this dispersion toward terminal propellant reserve without pretending to run a high-fidelity simulation. Reasoning must identify flight-observable variables, the point at which atmospheric estimation can be updated, thresholds that make the intended site unreachable, and the choice of a diversion zone. EDL becomes a connected decision chain rather than a catalogue of technologies.
The EDL capstone closes with a reachability question. A landing site is acceptable only while the vehicle can still divert to a safe point after accounting for state-estimation error and propellant reserve. The student therefore separates geometric reach from certified reach: the latter is smaller because it must contain uncertainty, control authority and a terminal reserve that remains usable after the diversion.
The acceptance log also keeps the predicted and measured state at each transition, allowing later review to separate atmospheric dispersion from guidance or propulsion error.