Water on Mars: 98% recovery, storage, quality and makeup
A water loop is robust only when it distinguishes what is recovered, what is actually potable or usable, what is buffered and what is lost. A high aggregate recovery rate can still hide insufficient storage, quality drift or an unavailable treatment line. Useful sizing therefore combines recovery, quality, buffer volume, makeup demand and the ability to isolate a contaminated branch.
A settlement does not “own” water: it maintains a circulation of matter
On Earth, turning a tap hides a continental infrastructure. On Mars, that infrastructure must fit inside pressurised modules, tanks, pumps, filters, sensors and an outside extraction chain. The useful mental model is therefore not a stock of water that is slowly consumed, but a permanent chemical plant. Water is collected, used, contaminated, recovered, requalified, stored and sent to another use. Each loop loses a fraction through waste, EVA operations, purges, leaks and exported products. Over years, that loss fraction matters more than the volume continuously circulating inside the habitat.
NASA reported in 2023 that the International Space Station had demonstrated the 98% total water-recovery goal with the Brine Processor Assembly. That is an important milestone, not proof of a zero-resupply colony. Later NASA reference material still describes operating configurations with different recovery figures depending on subsystem and operating state. For Mars, the engineering question is therefore: which streams are included in the percentage, for how long, with what maintenance burden, and where does the unrecovered fraction go?
The calculation that changes intuition: 98% is not almost 100% over long times
Take an explicit teaching scenario. Assume a gross cabin demand of 15 litres per person per day for drinking, food preparation, austere hygiene and miscellaneous cabin uses. This is not a NASA requirement; it is a transparent sizing assumption. Let q be gross daily demand per person, N population and η total recovery efficiency. Makeup flow is Qmakeup = N × q × (1 − η). The Greek letter η, eta, is the recovered fraction; 98% means η = 0.98.
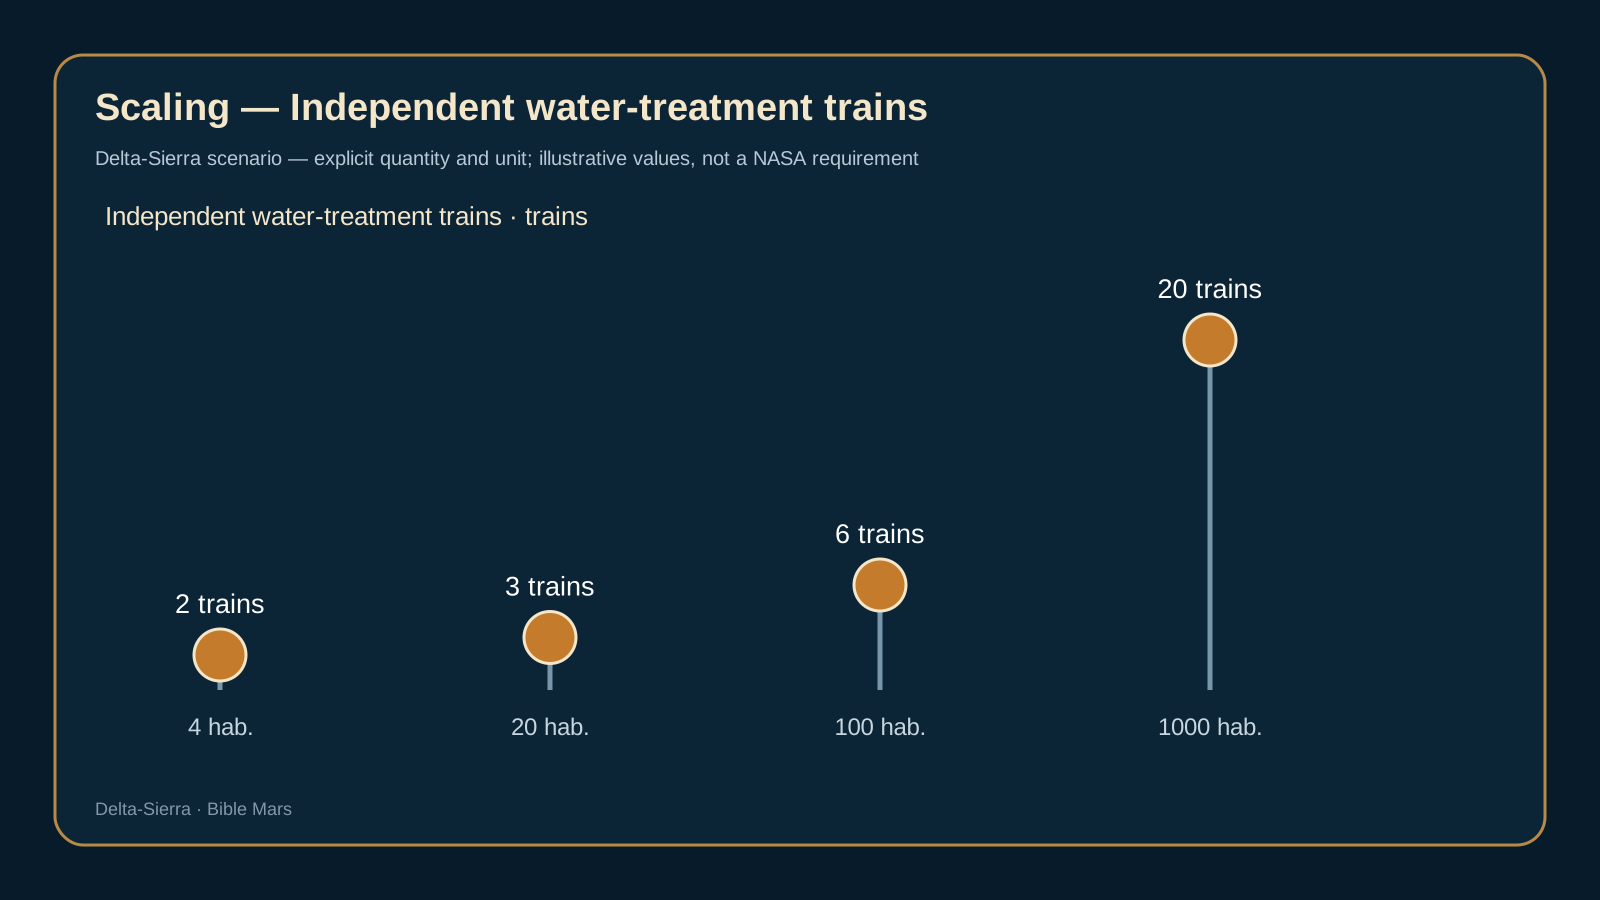
At q = 15 L/day and η = 0.98, one person still needs 0.30 L/day of new water. At the assumed make-up rate, scaling from four to twenty people raises the daily requirement from 1.2 to 6 litres; one hundred people need 30 litres and one thousand need 300 litres per day. Over one terrestrial year, that thousand-person settlement needs about 109,500 litres, or 109.5 cubic metres, merely to replace the two-percent loss in this selected loop. Agriculture, industrial losses, construction chemistry and propellant production are not included. A small percentage becomes a permanent mining and processing industry when population and time become large.
The same arithmetic shows why improving from 90% to 98% is much more consequential than “eight percentage points” sounds. At 90%, the same thousand-person case requires 1,500 L/day of makeup; at 98%, 300 L/day. The loss has been divided by five. Yet chasing 99.9% at any cost can be a poor trade if the last stages require fragile membranes, rare consumables, high power or maintenance that reduces total availability. Closure must be judged together with reliability.
From buried ice to a glass of water: ISRU is an industrial chain
NASA studies of Martian ISRU distinguish concentrated subsurface ice, hydrated materials and more diffuse resources. A remote hydrogen signature is not yet a mine. Engineers must know depth, concentration, grain size, boulders, temperature, contaminants, mechanical strength and whether an excavator or thermal probe can actually reach the material with the equipment delivered to Mars.
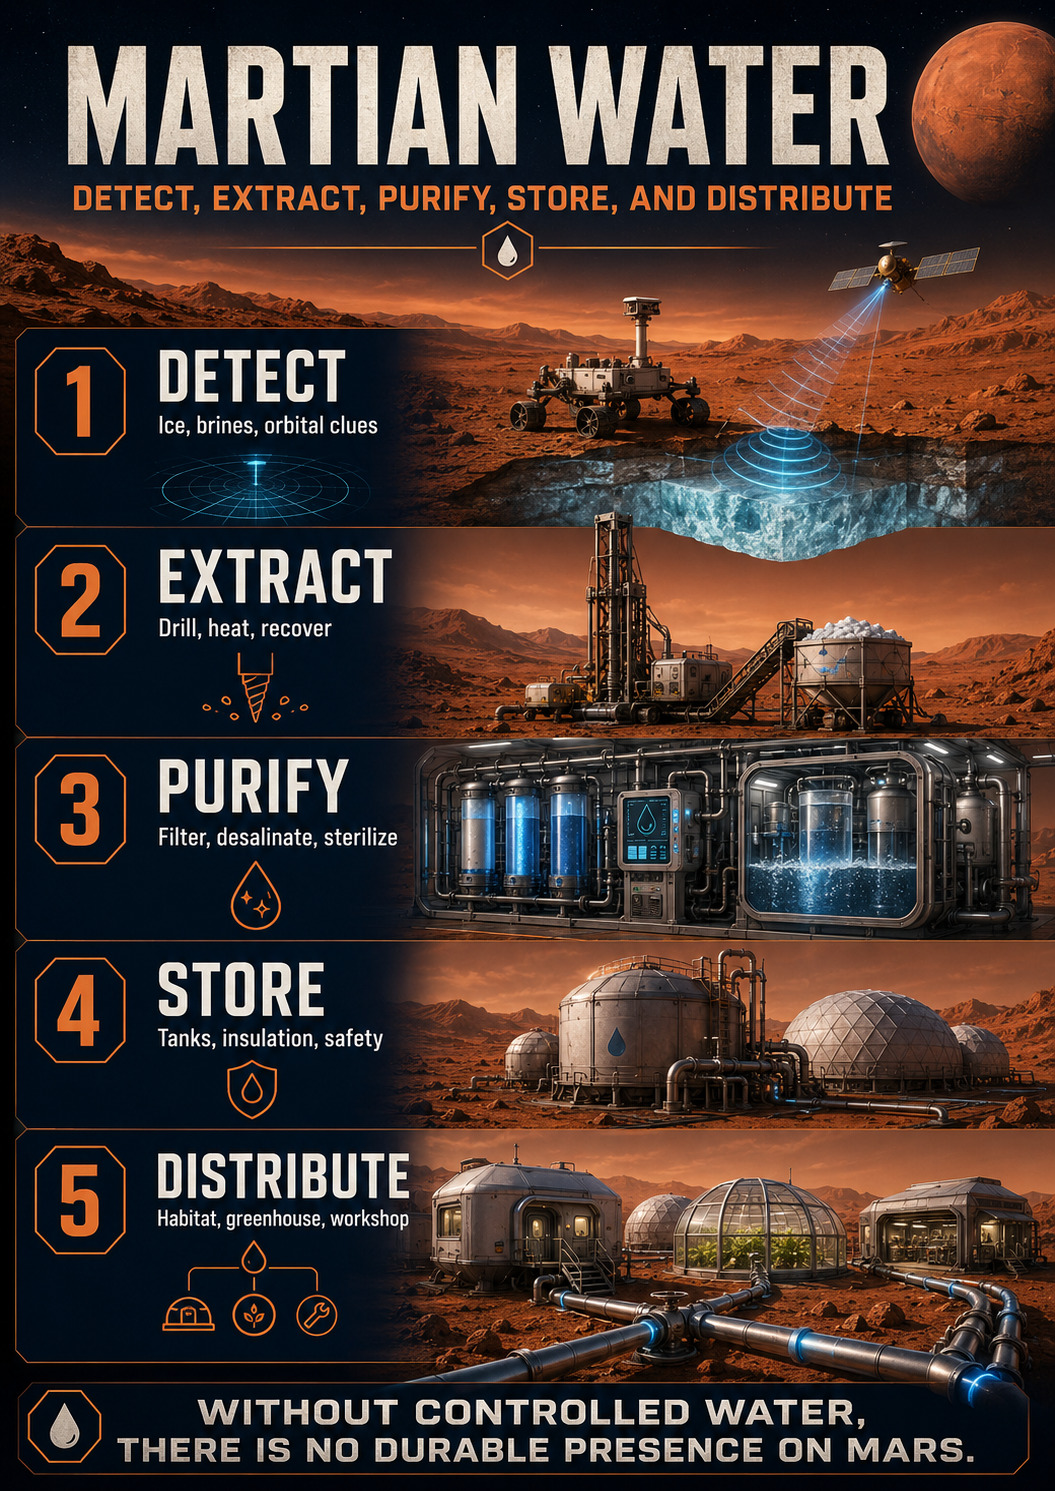
A complete water chain includes prospecting, excavation or in-place heating, material handling, water release, solid separation, condensation, purification, disinfection, analysis, storage and distribution. Every step consumes power and has failure modes. Rich ice can be a poor first resource if it lies beneath terrain that lightweight machinery cannot excavate. A poorer but accessible deposit can provide more useful kilograms per sol.
Conceptual subsurface-ice access: extraction, melting, filtration, microbial control and storage form a chain distinct from simply recovering water inside the habitat.
The performance metric must therefore become kilograms of qualified water per kilowatt-hour and per machine-hour, not merely tonnes of ice in the ground. If a plant handles 500 kg of material per hour at 20% water by mass, its theoretical maximum is 100 kg/h. At 75% end-to-end recovery after handling, heating, condensation and treatment, only 75 kg/h reaches storage. If maintenance and power availability reduce effective operation to eight hours per sol, daily output is about 600 kg rather than 2.4 tonnes. Making every assumption visible is the difference between geology and engineering.
Water quality, biofilms and multiple grades
A settlement does not need to polish every litre to drinking-water quality if the destination is equipment rinsing, thermal control or some agricultural processes. Multiple grades can save power and consumables, but they create cross-connection risk. The network therefore needs clear separation, backflow protection, sensors and a procedure for requalifying water when it moves from one grade to another.
Microbiology becomes a first-order concern when water circulates for years through warm plumbing. A biofilm can alter flow, interfere with sensors, shelter organisms from disinfectants and contaminate distant parts of a system. Materials, flow velocities, dead-leg elimination, disinfection, sampling and the ability to isolate and clean a branch are therefore part of water-system design.
Storage is time for maintainers
A nominally perfect loop with no buffer is brittle. Storage decouples biological time from repair time. A 24-hour reserve covers short faults; several days permit diagnosis and replacement; weeks can bridge a deeper logistics event or a shutdown of the outside extraction plant. For a thousand people, a five-litre-per-person potable buffer already means 5,000 litres. Ten days of makeup at 300 L/day adds 3,000 litres, while total loss of recycling changes the scale completely because the gross demand must then be covered.
Water, oxygen, crops and propellant compete for the same molecule
Electrolysis splits water into hydrogen and oxygen. Stoichiometry gives a useful check: 36 g of water contain 32 g of potential molecular oxygen, so producing 1 kg of O₂ theoretically sends 36/32 = 1.125 kg of water through electrolysis. If one thousand inhabitants consume 0.84 kg O₂ per person per day in a reference metabolic scenario, gross production is 840 kg O₂/day, corresponding to 945 kg of water through the electrolyser each day. Much of that matter can return through humidity capture and carbon-dioxide reduction, but the flow proves that water and atmosphere cannot be designed separately.
Agriculture moves still larger water flows: plants transpire water that can be condensed from greenhouse air. Propellant ISRU can demand tens or hundreds of tonnes outside the human loop. The settlement therefore needs separate inventories and priorities for life-support water, agricultural water, industrial water and water converted into propellant. Water security is not tank size; it is the ability to know every flow, recover useful streams, make local makeup, detect contamination and keep operating while one part of the system is on a workbench.
From a recovery percentage to an operating water balance
A settlement does not operate a percentage; it operates tanks, flows, sampling points and repairable hardware. The useful question is therefore not merely whether the recovery figure is high, but where the unrecovered fraction goes and how quickly it accumulates. In the teaching case used above, a four-person crew at 15 litres per person per day and 98% recovery requires 1.2 litres of make-up water each day. The same assumption gives 30 litres per day for 100 people and 300 litres per day for 1,000. The arithmetic is simple, but the engineering consequence is not: every persistent leak, rejected brine stream, sample, cleaning operation and maintenance loss must ultimately be covered by stored or locally produced water.
That is why water-quality monitoring belongs inside the mass balance. Recovered water that cannot be released for crew use because conductivity, organic contamination or microbiological indicators are outside their acceptance limits is temporarily unavailable even if it still exists physically in the system. A robust Martian architecture therefore separates inventory from usable inventory, keeps independent reserve volumes, and defines a degraded mode in which hygiene, food preparation, electrolysis and industrial users are prioritised rather than allowed to compete invisibly for the same stock.
NASA's International Space Station work is valuable here because it demonstrates regenerative recovery as an operational system, while Mars adds a second problem: the settlement must eventually connect that recycling loop to local extraction, purification and storage. Those are different engineering functions. Treating them separately makes it possible to ask which capability has actually been demonstrated in space, which has been demonstrated only in terrestrial test hardware, and which still belongs to a future Mars surface architecture.
Deep monograph
Accounting for every stream before saying “98% recycled”
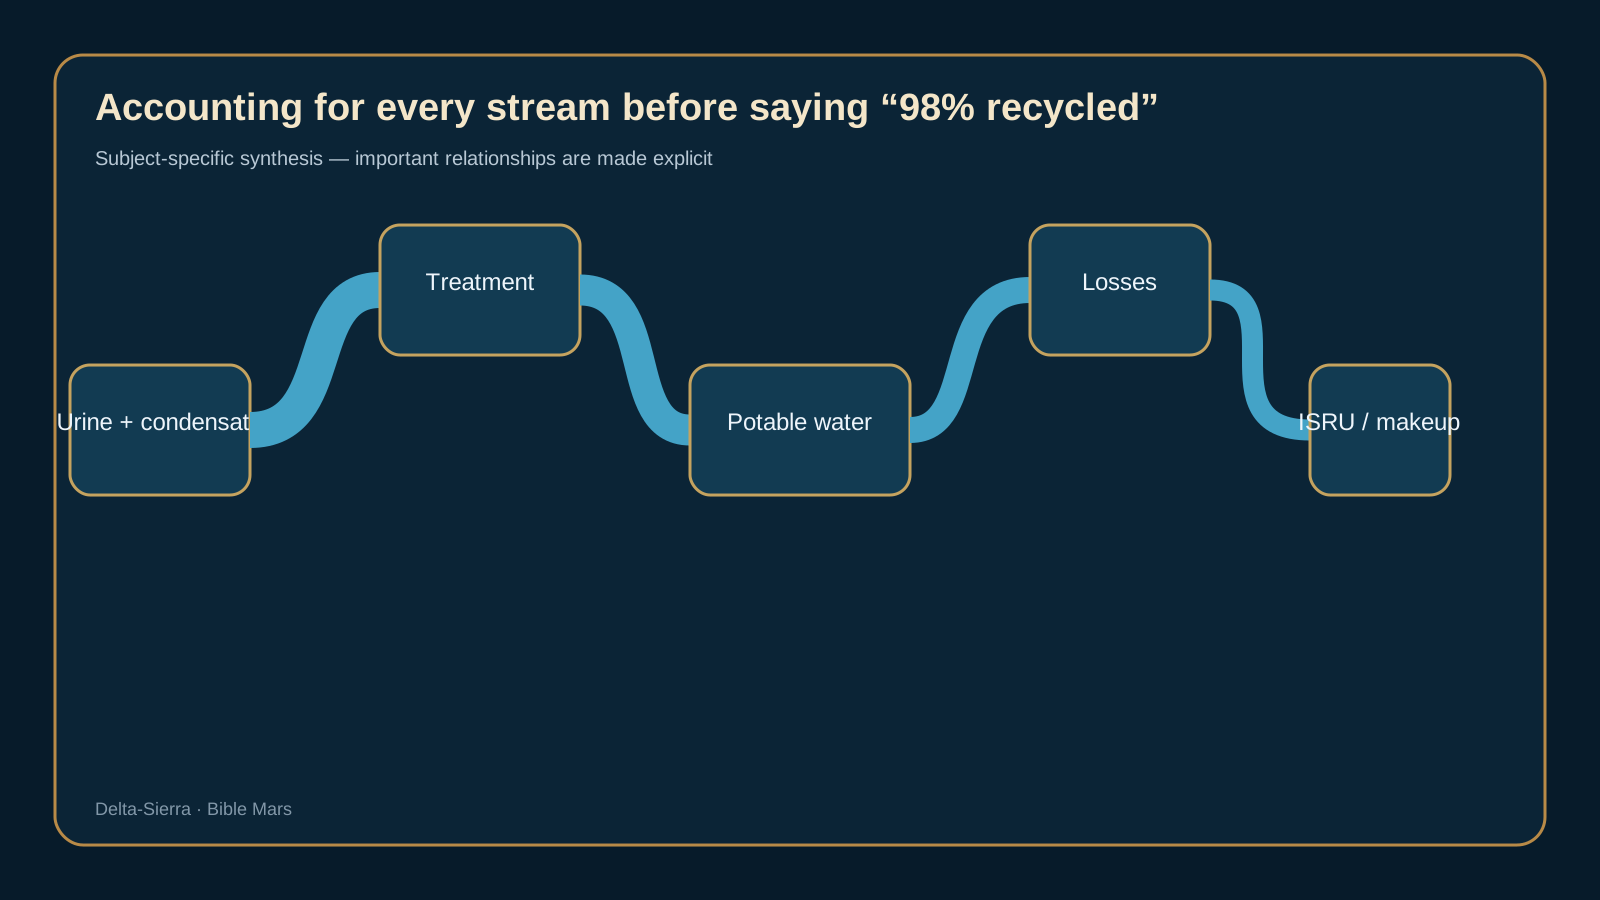
Accounting for every stream before saying “98% recycled”.
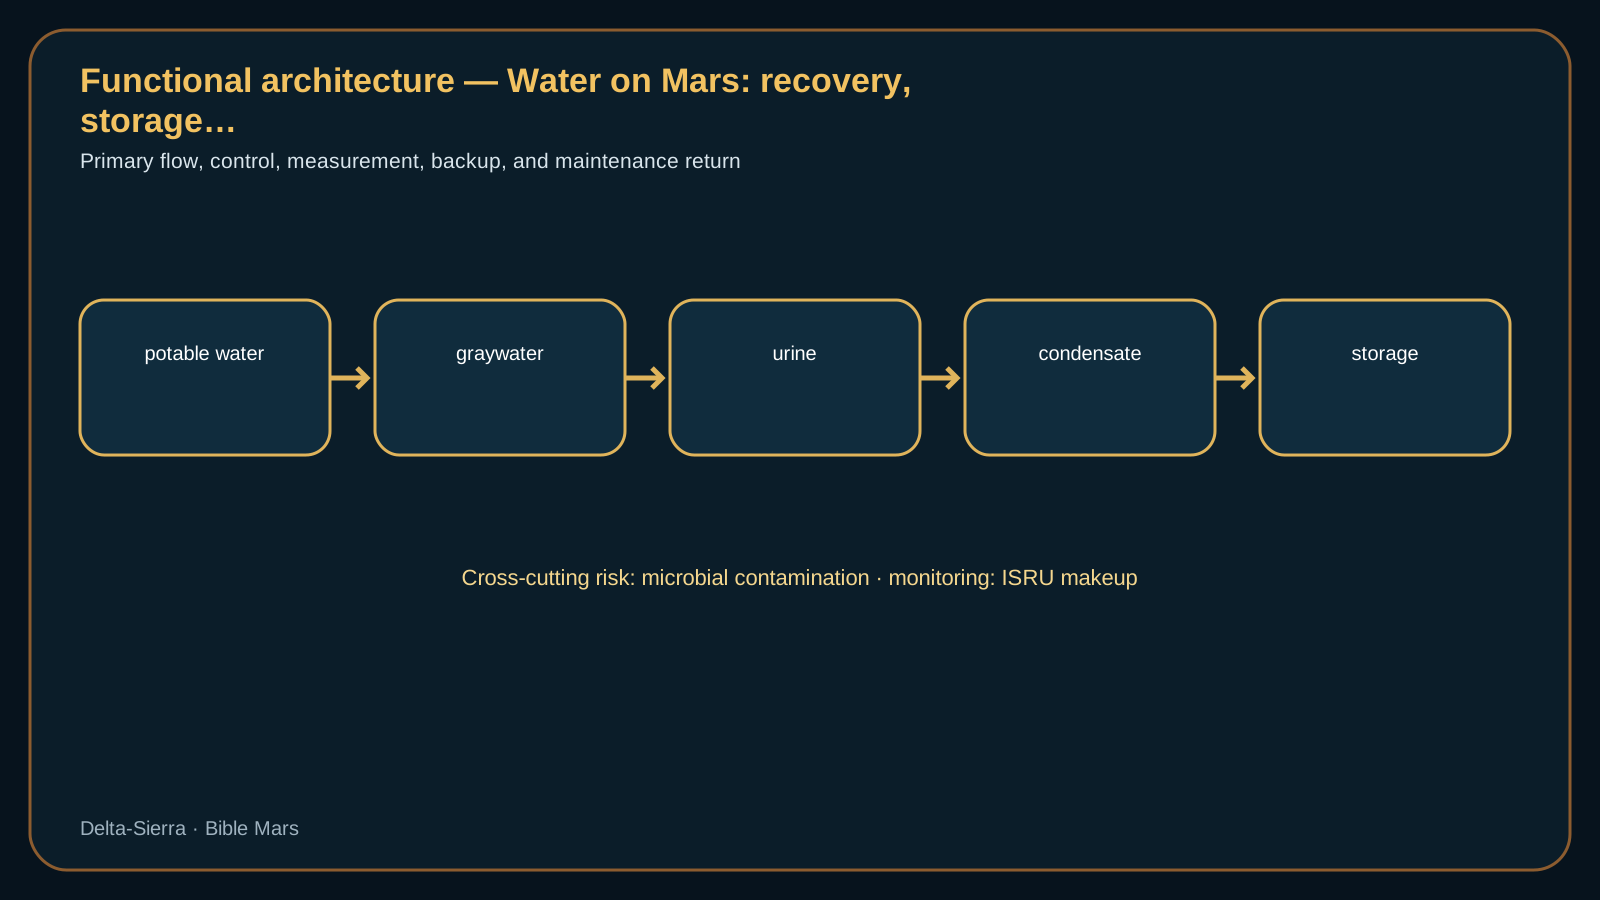
Water on Mars: 98% recovery, storage, quality and makeup — functional architecture showing the flows, interfaces and dependencies developed in the chapter.Water on Mars: 98% recovery, storage, quality and makeup — visual synthesis of the system-specific choices and constraints.
Where the liters go: drinking, cooking, hygiene, medicine, agriculture and industry.
What a 98% recovery rate really means.
Why 2% losses become tonnes over time.
Urine: useful water, salts, organics and the stability challenge. Architecture comparison should test at least two responses: strengthen condensate or improve recovery through remineralization.
Urine: useful water, salts, organics and the stability challenge.
Condensate: recovering vapor without recovering every contaminant
Condensate recovery is only useful when the crew knows what the recovered stream contains. Water vapor may condense while volatile compounds, microbes or cleaning residues follow different paths. A Martian plant therefore needs sampling points before and after treatment, trend histories for conductivity and organic load, and a way to divert suspect condensate instead of automatically returning it to the potable tank. The design problem is operational: a sensor that drifts slowly can be more dangerous than a pump that stops, because it can keep a contaminated stream inside the loop while every dashboard still appears nominal.
Graywater: deciding what can be locally reused or needs full treatment
Graywater should not be treated as a single substance. Shower water, hand-washing water and cleaning effluent can carry very different loads of surfactants, salts, skin debris and microbes. A robust Mars architecture therefore classifies streams by origin and by intended reuse. Water suitable for toilet flushing or industrial washing does not automatically qualify for food preparation. Separating the streams also creates a degraded mode: if the high-grade purification train is unavailable, lower-grade uses can continue without consuming the entire potable reserve.
Water quality is a measurement chain, not a color
Potable quality: chemistry, microbiology, taste and public trust.
Disinfection: killing microbes without creating a new chemical problem. Architecture comparison should test at least two responses: strengthen remineralization or improve recovery through graywater.
Disinfection: killing microbes without creating a new chemical problem.
Storage: several tanks rather than one indoor lake.
Freezing and thermal control: phase change can destroy a pipe
Freezing is a mechanical failure mode as much as a thermal one. Water trapped in a valve body, dead leg or poorly drained pipe can expand as it freezes and crack hardware that otherwise survives the cold. Mars makes that risk persistent because pipework may cross airlocks, buried service corridors and exterior interfaces with very different temperatures. The safe design therefore combines insulation, heat tracing, drainage geometry, temperature sensing and procedures that identify which sections must be emptied before power is shed.
Freezing and thermal control: phase change can destroy a pipe.
Leak detection: mass balance, hidden humidity and inspection
Leak detection should combine several clues rather than wait for a tank level alarm. A slow loss can appear as an unexplained mismatch between production and consumption, a local rise in humidity, damp insulation, pump duty-cycle changes or an increase in make-up water. Those signals become more useful when they are trended together. In a multi-habitat settlement, the water network should also be isolatable by zone so that a suspected leak can be narrowed without shutting down every user. The goal is not perfect sensing; it is to turn a hidden loss into a bounded, inspectable problem before strategic inventory is consumed.
Leak detection: mass balance, hidden humidity and inspection.
Leak detection: mass balance, hidden humidity and inspection. Who may modify potable water?
Fire water: a critical reserve that cannot depend on one loop.
Fire water: a critical reserve that cannot depend on one loop. Uncertainty — fire water: a critical reserve that cannot depend on one loop.
Reproducible calculations specific to this subject
Two percent loss
L = Q × (1 − η) = 400 L/j × 0,02 = 8 L/j; soit 2 920 L/an
A 98% recovery rate looks close to perfect closure. Yet on a 400-litre daily stream, the 8 litres lost each day become nearly three cubic metres per year that must be replaced, stored or extracted.
The calculation uses 20 L per person per day as a treated-flow assumption, not as a universal consumption value. It shows why a negligible crew-scale loss becomes a major ISRU or storage requirement at city scale.
One-week buffer
V = N × q × t = 100 × 25 L/j × 7 j = 17 500 L = 17,5 m³
For one hundred residents and an assumed critical daily need of 25 litres per person, seven days of autonomy require 17.5 m³. The architectural question then becomes whether to use one tank or several isolatable volumes, and where to place them.
Adding Martian water without contaminating the human loop
Medical water: dialysis, sterilization, washing, pharmacy and exceptional demand
Medical water creates demand peaks that ordinary domestic averages can hide. Sterilization, wound irrigation, instrument washing and some pharmaceutical preparation require reliable quality at the moment of need, including during emergencies when the main treatment plant may already be degraded. A Mars hospital therefore needs a protected inventory, verified quality criteria and a connection strategy that prevents a contaminated general loop from silently reaching critical-care uses. The important design question is how long essential care can continue while the main purification chain is isolated, sampled and repaired.
Medical water: dialysis, sterilization, washing, pharmacy and exceptional demand. The function “potable water” interacts with condensate and chemical analysis, while hazards undetected organic compound and pump failure can cross disciplinary boundaries.
Agriculture: water becomes nutrient solution and biological vector.
ISRU: ice, hydrated regolith, extraction, purification and energy cost.
Twenty people: first parallel loops and local laboratory.
One hundred people: water network, metering, quality and continuous maintenance.
Independent water-treatment trains — scaling scenario: the quantity and unit are illustrative and are not a NASA requirement.
Four architecture scenarios that materially change the decision
One contaminated tank
One contaminated tank. Analysis reveals contamination in a main tank while production continues. The architecture must isolate that volume, preserve potable stock, trace distributed water batches and decide whether suspect water can be reprocessed. Pump redundancy does not help if all tanks share the same contamination.
Two percent becomes logistics
Two percent becomes logistics. A small base tolerates a few litres of daily makeup; a population of one thousand turns the same loss fraction into hundreds of cubic metres per year. Scaling therefore links recovery, ISRU, seasonal storage and repair capacity. The scenario shows why efficiency must always be read together with total throughput.
Biofilm in a rarely used line
Biofilm in a rarely used line. A backup line remains stagnant for months and is suddenly needed. The problem is not only microbiological: it affects flushing, disinfection, materials, sensors and storage policy. The scenario tests whether backup hardware remains truly ready after long dormancy.
An external ISRU line freezes
An external ISRU line freezes. Local water was meant to replenish the internal loop, but an external line freezes and stops makeup supply. The human water network must continue without immediate dependence on the ISRU plant. This case sets a buffer requirement and reminds us that “local resource available” does not mean “potable water available every minute.”
Why two percent losses become tonnes
One thousand people: production, technical sewers, reserves and water governance.
Metrology: water declared safe must be measured with known uncertainty.
Contamination scenario: isolate, trace, purge, disinfect and rebuild trust.
What must still be learned before a Martian city: membrane, material and microbiome aging.
Water is not just a resource: it is a critical flow to close
“Water on Mars: 98% recovery, storage, quality and makeup” addresses water accounting that separates demonstrated recovery, quality, storage, losses and makeup.
Scope — the stated recovery boundary: collected streams, treatment, produced water and rejected material.
Water-system operators should trend flow rate, conductivity, organic carbon, microbial indicators, tank level, subsystem recovery and losses.
Relationship used here: 100 L at 98% recovery means 98 L recovered and 2 L not recovered within that stated boundary. Units and physical meaning are stated before substitution.
NASA reported a 2023 demonstration of about 98% total water recovery with the Brine Processor Assembly; that value is not an “air plus water” recycling rate
Recompute 100 L at 98% recovery means 98 L recovered and 2 L not recovered within that stated boundary with units visible. The result is not accepted in isolation: then check whether the change also modifies flow rate, conductivity, organic carbon, microbial indicators, tank level, subsystem recovery and losses.
If the reference failure — quality or recovery degrading while one aggregate percentage still looks satisfactory — makes observation insufficient, the correct action may be degraded mode even while the nominal calculation remains mathematically positive.
From a lost drop to contamination: tracking, diagnosing and recovering
The dangerous water-system signal is declining quality or recovery hidden behind an aggregate percentage that still appears satisfactory.
Storage, quality and makeup: sizing a loop that ages
raising recovery without making purification, energy, maintenance or residual waste unmanageable
input-output mass balance, water-quality analysis, long-duration operation, residual tracking and fault scenarios
Operational log: flow rate, conductivity, organic carbon, microbial indicators, tank level, subsystem recovery and losses.
When the water network becomes a backbone of the city
NASA NTRS — Status of ISS Water Management and Recovery (2023) — The ISS water-management status is used to tell the real architecture of collection, processing, storage and quality control. It is an operational reference while Mars must absorb much longer duration and far greater logistics autonomy.
NASA NTRS — Water Recovery System Test, 116 days — A multi-month closed test helps explain why nominal performance is not enough: drift, contamination, maintenance, consumables and biological control emerge over time. The book uses that logic to build multi-year scenarios.
NASA NTRS — Biofilm Management in Microgravity Water Recovery Systems — Biofilms show that a water loop is also a microbial ecosystem. This source connects materials, hydraulics, disinfection, sensors and maintenance; by itself it does not predict behavior under Martian gravity.
The 98% trap: a city can recycle almost all its water and still need hundreds of tonnes of makeup. The International Space Station demonstration using the Brine Processor Assembly crossed an important threshold. In 2023 NASA reported that the combined system had demonstrated about 98% total water recovery, compared with roughly 93–94% previously. That is a major life-support achievement. For a Mars settlement, however, the useful question is not simply “what percentage is recovered?” It is 98% of what throughput, for how many years, and where do the missing 2% go?
Recovery percentage acts on a flow that repeats every day. A few percentage points can therefore become tens of tonnes per year at community scale.
The equation every reader should be able to reproduce. Let q be the daily water throughput through a recovery loop in kilograms per person per day, N the population, and R the recovery fraction written as a decimal. Ideal daily makeup is:
M_makeup = q × N × (1 − R).
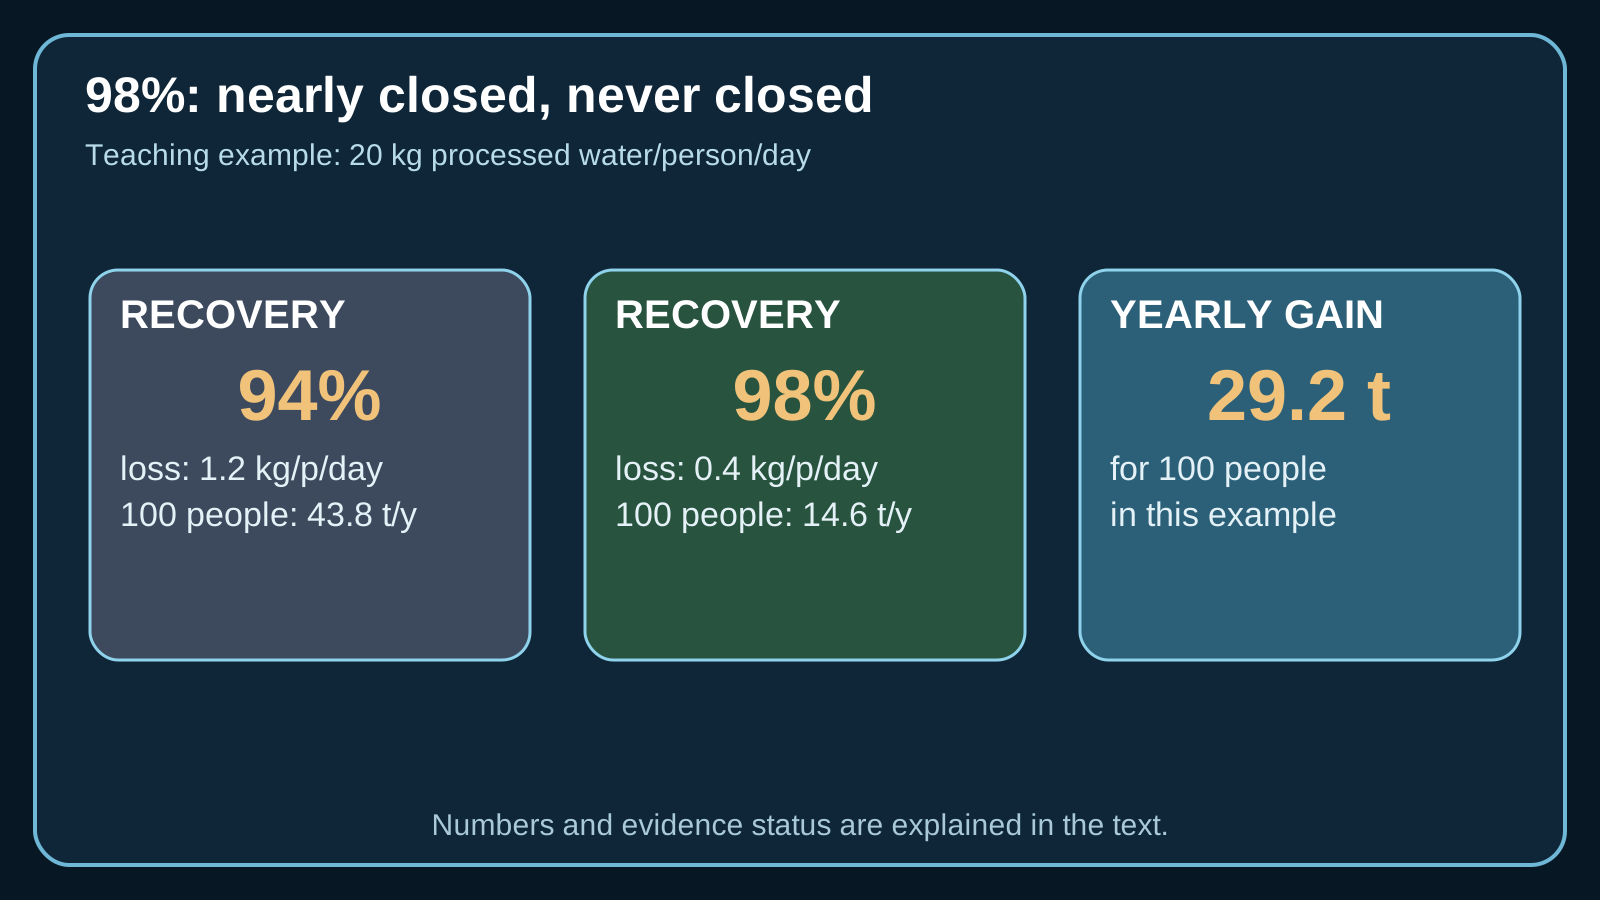
M_makeup is the mass that must be returned to the loop because it was not recovered. Use a teaching scenario of q = 20 kg/person/day. This is not a NASA requirement; it is deliberately chosen to make the mathematics visible. At 98%, one person loses 20 × 0.02 = 0.4 kg/day. For one hundred people that is 40 kg/day. Over 365 days: 40 × 365 = 14,600 kg, or 14.6 tonnes per year. At one thousand people, the same scenario reaches 146 tonnes per year.
Why moving from 94% to 98% matters more than it sounds. With the same 20 kg/person/day teaching throughput, 94% recovery leaves 1.2 kg/person/day to replace; 98% leaves 0.4 kg. The loss rate is divided by three. For one hundred people, the annual makeup is about 43.8 tonnes at 94% versus 14.6 tonnes at 98%. The difference is 29.2 tonnes every year. A short mission can launch that difference. A city has to mine, purify, store and distribute it, while providing the associated energy.
A real loop does not have one universal recovery rate. The ISS “98%” is an aggregate performance in a specific architecture. A Martian settlement will have multiple water qualities and pathways: urine, humidity condensate, hygiene water, cooking water, agricultural solution, industrial process water, medical water, system purges and water bound into products. A single headline number can hide one excellent loop and another highly dissipative one. A serious water balance therefore reports each stream: input mass, recovered mass, rejected mass, stored mass and measurement uncertainty.
Buffer inventory turns a failure into repair time. If a one-hundred-person settlement has 20 tonnes of usable buffer water and normally needs 40 kg/day of makeup in the teaching scenario above, that stock would theoretically cover 20,000 / 40 = 500 days of normal makeup. It does not mean 500 days of survival after total recovery failure. If recycling stops, the required supply moves back toward gross throughput and the same inventory may disappear in days or weeks. Reserve sizing must therefore be calculated for several modes: nominal operation, degraded recovery, loss of one train and contamination of a storage tank.
What 98% does not solve: quality, biofilm and trust. Water that is chemically clean at a processor outlet can be contaminated again in a pipe or tank. On Mars a closed network will run for years with wet surfaces, stagnation periods, aging materials and changing microbial communities. Maturity is therefore not proven by saying “the filter works.” It is proven by detecting drift, finding the affected segment, isolating it without shutting down the entire settlement, disinfecting it and then demonstrating by measurement that the water is safe again.
A total water-recovery percentage is useful for scale, but it cannot replace stream-by-stream balances. Urine, condensate, hygiene, cooking, agriculture and industrial water differ in contamination and value. A robust architecture knows which loops may be recombined, which should remain separated, and where irreversible losses occur.
At settlement scale, tenths of a percentage point become tonnes per year. Operators therefore track degradation of recovery as well as nominal performance and keep buffers large enough to investigate contamination without stopping the whole network. Storage becomes time available for correct diagnosis, not merely makeup water.
Closing the water loop requires separating quantity from quality. A high aggregate recovery rate can hide major differences among humidity condensate, urine, hygiene water, galley effluent, and brines. Each stream brings its own salts, organics, microbes, or cleaning products. Control therefore has to track not only kilograms recovered but also the permitted destination of the product water. Water acceptable for a technical use is not automatically potable. Real loop closure depends on sampling, sensors, treatment consumables, the ability to clean lines, and enough buffer volume to isolate a suspect stream without immediately rationing the whole habitat.
Strategic reserve volume should be tied to the recovery time of credible failures. If a processor fails while humidity condensate can still be collected, the daily deficit differs from a contamination event that forces several tanks out of service. Diagnosis must quickly separate a performance problem from a bad sensor, chemical contamination, or biological contamination. Those cases demand different responses: repairing a pump, replacing a consumable, disinfecting a line, or quarantining a water volume do not require the same tools or the same time. A robust water architecture is therefore a combination of recovery, quality assurance, compartmented storage, and restoration capability.
Sources and documentary findings
Accounting for every stream before saying “98% recycled”: the references below are retained because they contribute a result, technology status or verification framework directly useful to this subject.
NASA — Environmental Control and Life Support Systems (ECLSS)
NASA TechPort — Advanced Mars Water Acquisition System
AMWAS matters here as a makeup-water example: the TechPort project studied a chain in which water released from Martian-soil simulant is transported, condensed and then purified. For a water architecture, the point is that local supply arrives with its own treatment train and joins potable storage only after separation and quality control.
A Martian water-bearing resource is not automatically crew-ready water. Excavating and hauling ice or hydrated soil creates a different sequence of heating, separation, cleanup, storage, and sanitary verification than treatment close to the deposit. Habitat water-recovery percentage therefore does not describe local extraction efficiency.
The 2026 food-system study affects the water ledger directly. Drier prepackaged food can reduce launch mass, but it shifts demand into the water loop, meal preparation, and storage. The logistics benefit therefore has to be evaluated at system level rather than from food mass alone.