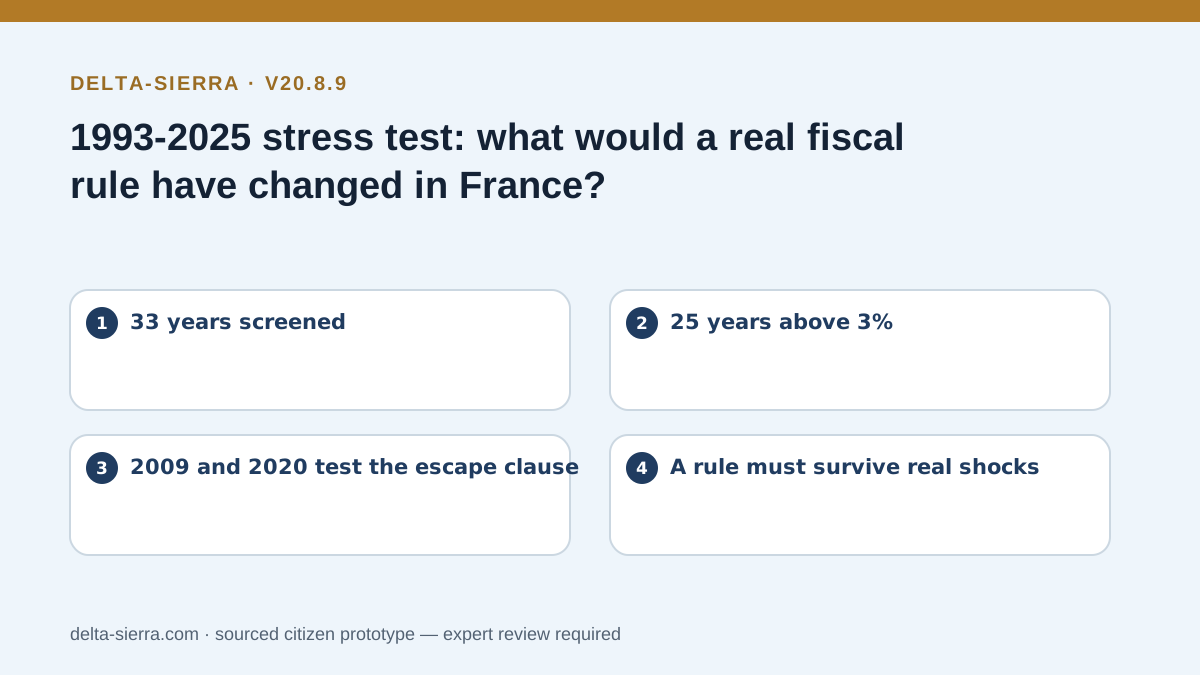
33 years
1993-2025 screened.
delta-sierra.com
David Salvan: narratives, analysis and proposals
A historical screen of French deficits, crisis years and the design lessons for a future constitutional fiscal rule.
1993-2025 screened.
years with a nominal deficit.
above the EU 3% deficit reference.
2009, 2020 and 2021 test the escape clause.
The source draft contemplated war or a major natural disaster and capped the exceptional deficit at 2% of GDP. A mechanical historical screen shows that this would not accommodate a 2009- or 2020-type shock. therefore tests a certified, time-limited escape clause with an extraordinary account and mandatory future amortisation.
| Year | Deficit | Spending | Revenue | Crisis | Hybrid alert |
|---|---|---|---|---|---|
| 1993 | -6.4% | 55.2% | 48.8% | No | ROUGE |
| 1994 | -5.4% | 54.6% | 49.2% | No | ROUGE |
| 1995 | -5.1% | 54.8% | 49.7% | No | ROUGE |
| 1996 | -3.9% | 54.9% | 51.0% | No | ROUGE |
| 1997 | -3.7% | 54.5% | 50.9% | No | ROUGE |
| 1998 | -2.4% | 52.9% | 50.5% | No | ORANGE |
| 1999 | -1.6% | 52.6% | 51.0% | No | ORANGE |
| 2000 | -1.3% | 51.7% | 50.3% | No | ORANGE |
| 2001 | -1.4% | 51.7% | 50.3% | No | ORANGE |
| 2002 | -3.2% | 52.8% | 49.6% | No | ROUGE |
| 2003 | -4.0% | 53.3% | 49.3% | No | ROUGE |
| 2004 | -3.6% | 53.0% | 49.4% | No | ROUGE |
| 2005 | -3.4% | 53.3% | 49.9% | No | ROUGE |
| 2006 | -2.4% | 52.9% | 50.4% | No | ORANGE |
| 2007 | -2.6% | 52.6% | 49.9% | No | ORANGE |
| 2008 | -3.3% | 53.3% | 50.0% | No | ROUGE |
| 2009 | -7.2% | 57.2% | 50.0% | Yes — global financial crisis | ROUGE EXCEPTION |
| 2010 | -6.9% | 56.9% | 50.0% | No | ROUGE |
| 2011 | -5.2% | 56.3% | 51.1% | No | ROUGE |
| 2012 | -5.0% | 57.1% | 52.1% | No | ROUGE |
| 2013 | -4.1% | 57.2% | 53.1% | No | ROUGE |
| 2014 | -3.9% | 57.2% | 53.3% | No | ROUGE |
| 2015 | -3.6% | 56.8% | 53.2% | No | ROUGE |
| 2016 | -3.6% | 56.7% | 53.0% | No | ROUGE |
| 2017 | -3.0% | 56.5% | 53.5% | No | ORANGE |
| 2018 | -2.3% | 55.6% | 53.4% | No | ORANGE |
| 2019 | -3.1% | 55.4% | 52.3% | No | ROUGE |
| 2020 | -8.9% | 61.7% | 52.8% | Yes — COVID-19 pandemic | ROUGE EXCEPTION |
| 2021 | -6.6% | 59.5% | 52.9% | Yes — COVID-19 pandemic | ROUGE EXCEPTION |
| 2022 | -4.7% | 58.4% | 53.7% | No | ROUGE |
| 2023 | -5.4% | 56.8% | 51.4% | No | ROUGE |
| 2024 | -5.8% | 57.0% | 51.2% | No | ROUGE |
| 2025 | -5.1% | 57.3% | 52.2% | No | ROUGE |