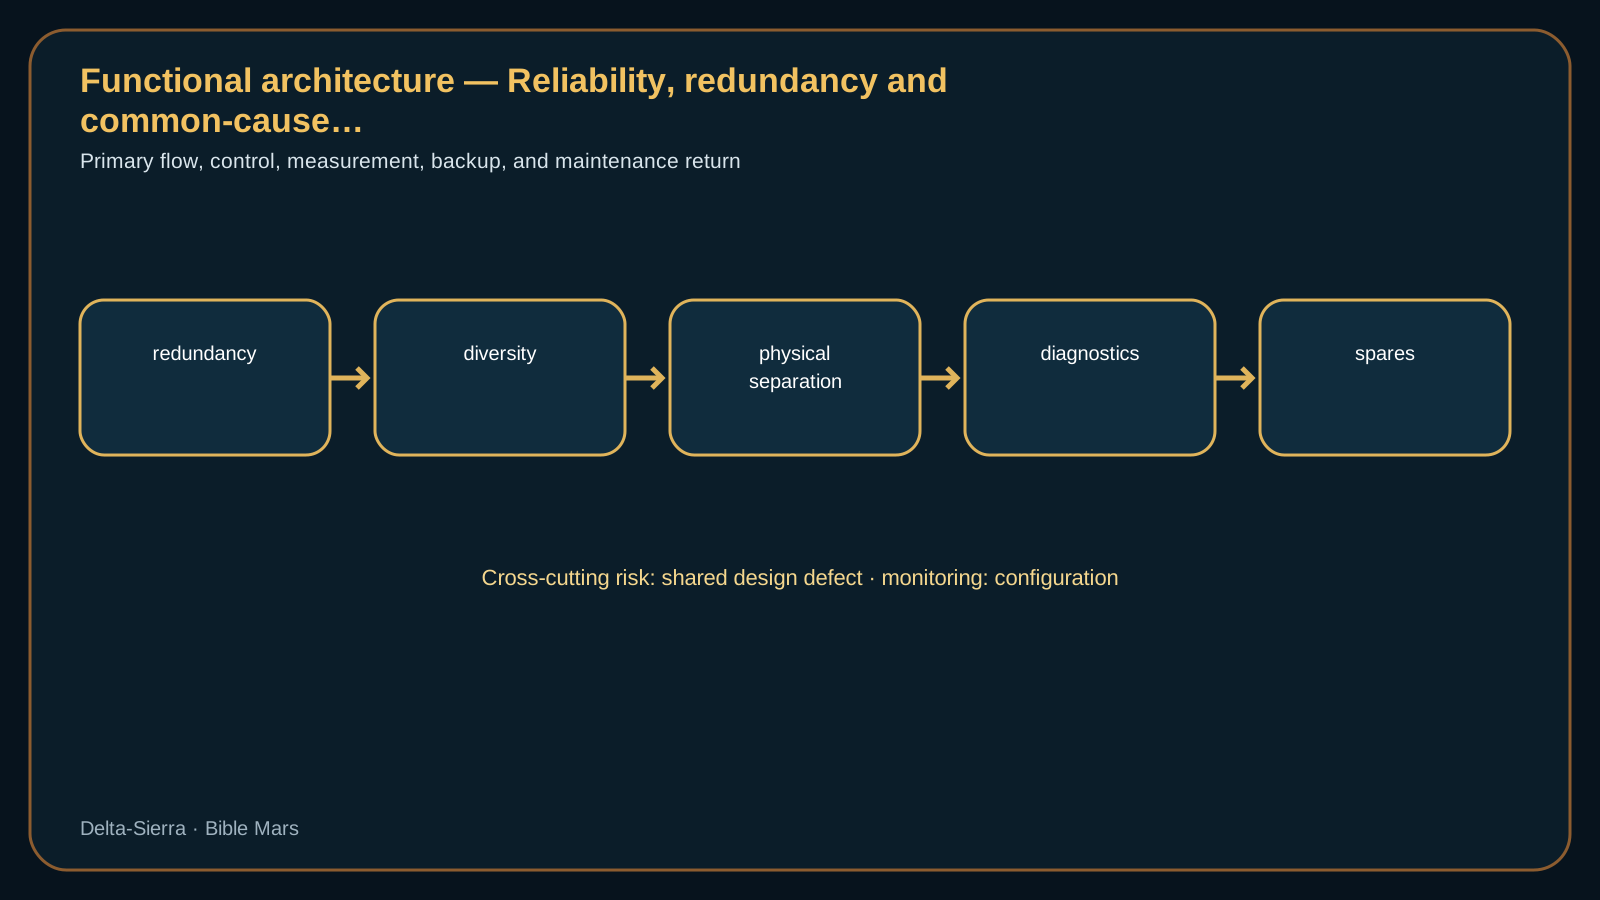
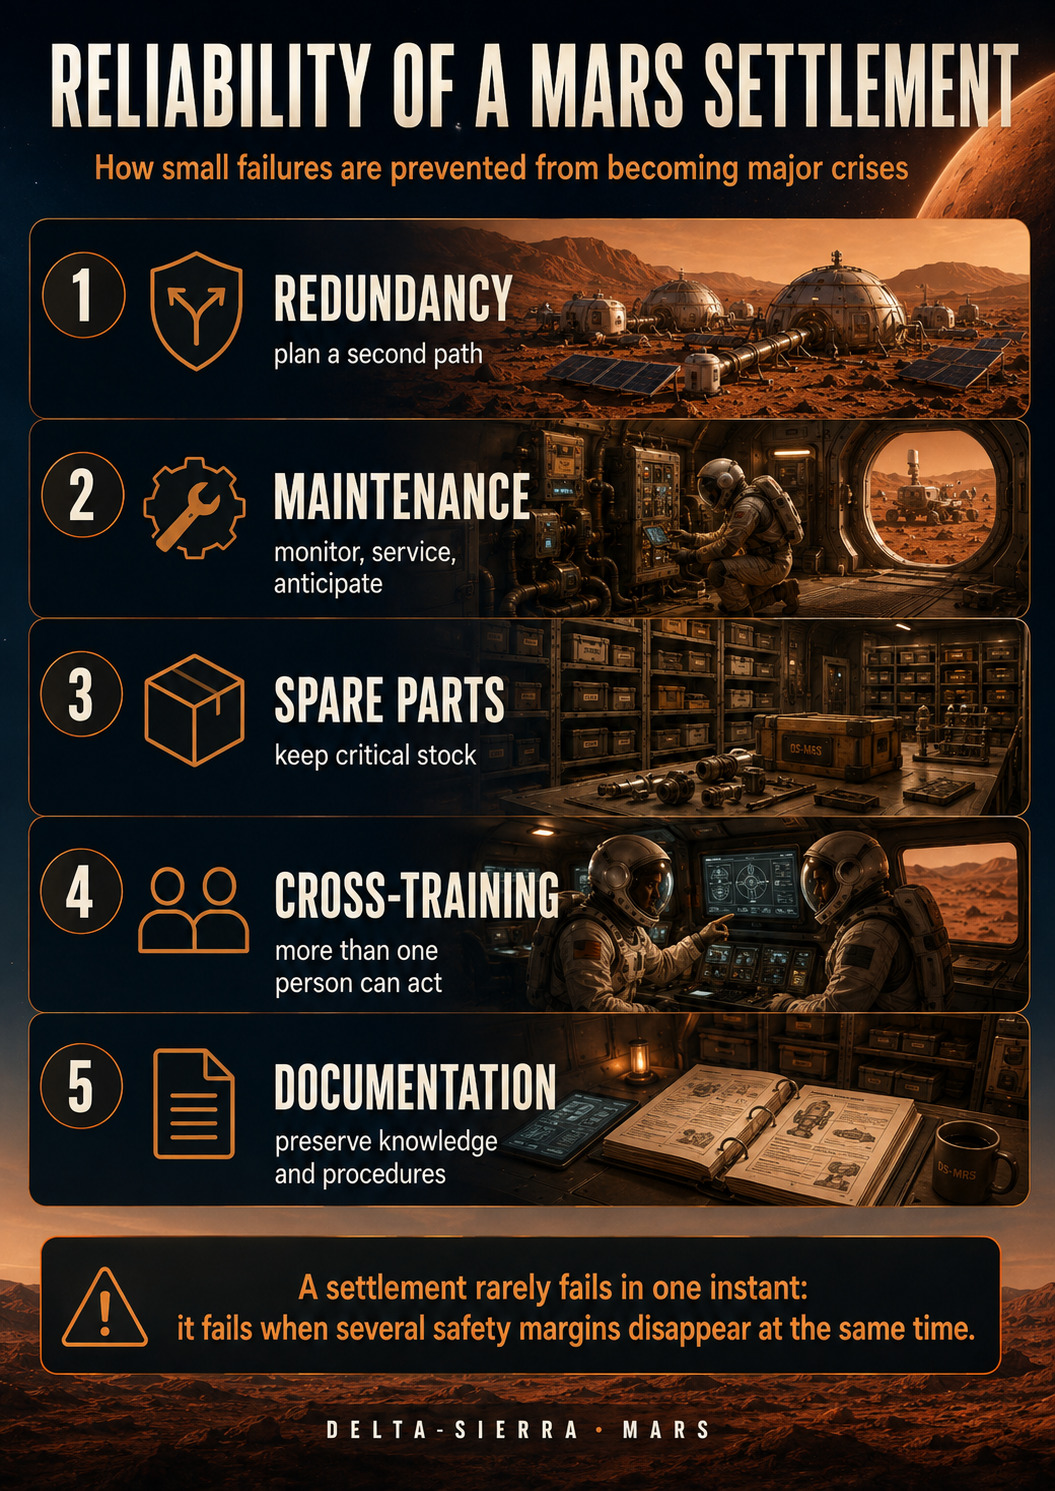
Conceptual visualisation of degraded operation: a fault can coincide with an adverse environment. Real reliability must therefore address common causes—dust, power, temperature, EVA access and human error—not merely count redundant components.
Why two identical units do not always provide twice the safety
“Reliability, redundancy and common causes in a Mars base” addresses base reliability as preserving function through independent failures and common causes.
The central observables are failure rate, availability, dependency, fault-coverage, repair time, spare inventory and common-mode exposure.
Those omissions are engineering information.
NASA Reliability & Maintainability practice treats reliability, maintainability and evidence as connected disciplines
This evidence is used only for what it demonstrates.
Recompute parallel reliability math is valid only when the assumed independence is justified with units visible. The result is not accepted in isolation: then check whether the change also modifies failure rate, availability, dependency, fault-coverage, repair time, spare inventory and common-mode exposure.
Redundancy works only when failure chains are separated
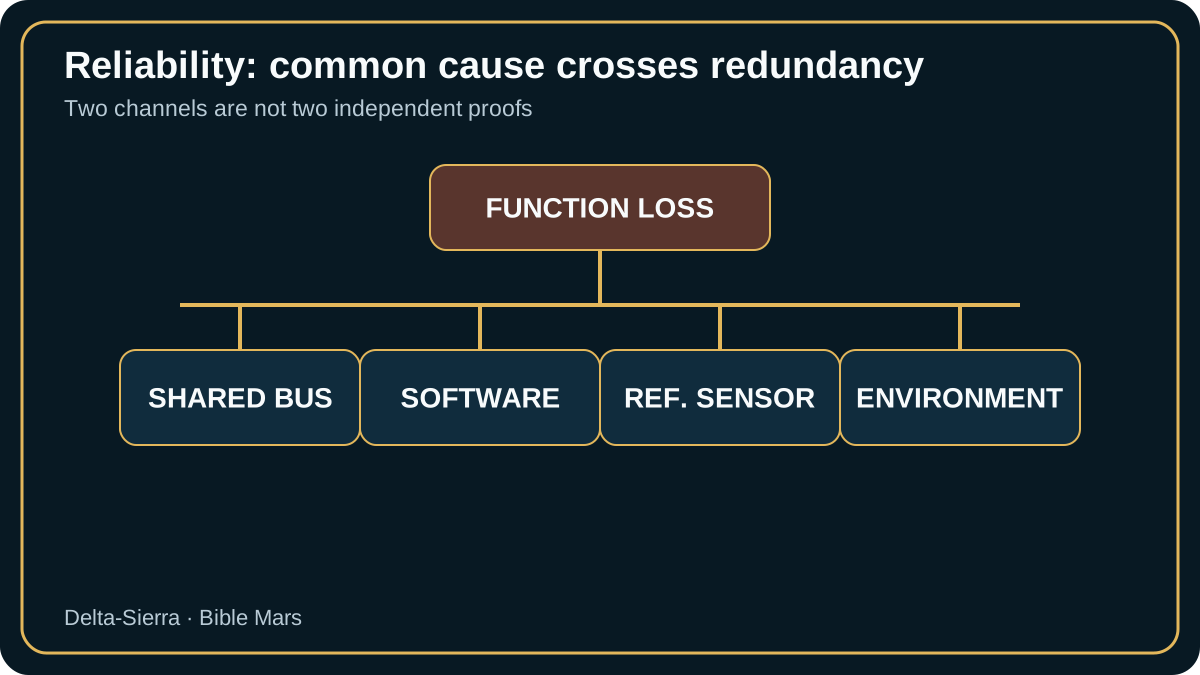
Two identical units do not automatically create a fault-tolerant architecture. They may share software, a power converter, cooling, a manufacturing lot or the same maintenance procedure. Common-cause analysis searches for exactly those hidden dependencies. For a life-critical function, the design must state which resources remain independent after fire, loss of a bus, a bad software update or contamination of a stock. Separation can be physical, electrical, software-based, organisational or temporal depending on the failure mechanism.
Reliability on Mars is therefore mission-oriented rather than a component score. A function may be unavailable for hours without endangering the crew if refuge or reduced capability exists, while another needs near-continuous service. Reliability allocations, repair times and spares become useful only when translated into scenarios: what remains after the first failure, which second failure then becomes critical, and how long does the crew have to recover a safe configuration?
Redundancy, diversity and physical separation: choosing what really protects
avoiding cosmetic redundancy by using diversity, separation and repairability where they add real resilience
FMEA/FMECA, fault trees, failure injection, duration data and explicit common-cause review
Verification asks whether the requirement is met;
Measuring reliability for a base that cannot call Earth for repair
Designing for failure: Martian reliability begins when single-fault thinking ends
Redundancy is often summarized by a comforting picture: if one pump fails, a second takes over. Yet two identical pumps may share the same software, power bus, seal batch, contaminated fluid or maintenance error. The real question is not “how many copies?” but “which causes can defeat them together?”
Common cause is the hidden enemy of N+1
An N+1 architecture provides one additional unit beyond nominal demand. It works well against some independent failures and much less well against a shared cause. Diversity can then be more valuable than duplication: sensors based on different principles, separated power supplies, independent measurement chains or physical separation against fire and local flooding.
Diversity also has a cost. Two technologies mean two spare inventories, two diagnostic methods and additional training. Good architecture finds the point where diversity reduces common-cause risk without making maintenance unmanageable.
Reliability, availability and maintainability are different quantities
A device can fail rarely but remain unavailable for weeks because the correct part is missing; another can fail more frequently and be repaired in minutes. Settlement availability therefore depends on both failure frequency and restoration time. NASA maintainability and spares-analysis work exists precisely because deep-space missions cannot assume the frequent-resupply model of low Earth orbit.
Useful metrics follow the function. Minutes of lost air revitalization may matter; several days without a secondary additive-manufacturing machine may be acceptable. Criticality determines redundancy, stock and monitoring.
A base must degrade gracefully
Robustness does not mean keeping every service at full power throughout a crisis. A Martian town should be able to shed load: slow industrial plants, suspend experiments, reduce heating in unused volumes, park vehicles and concentrate resources on life-critical functions. Graceful degradation prevents the attempt to save everything from causing a total collapse.
The policy belongs in the design. Which threshold triggers shedding? Who has authority? Which service restarts first? How is recovery verified? Reliability, operations and governance meet in those decisions.
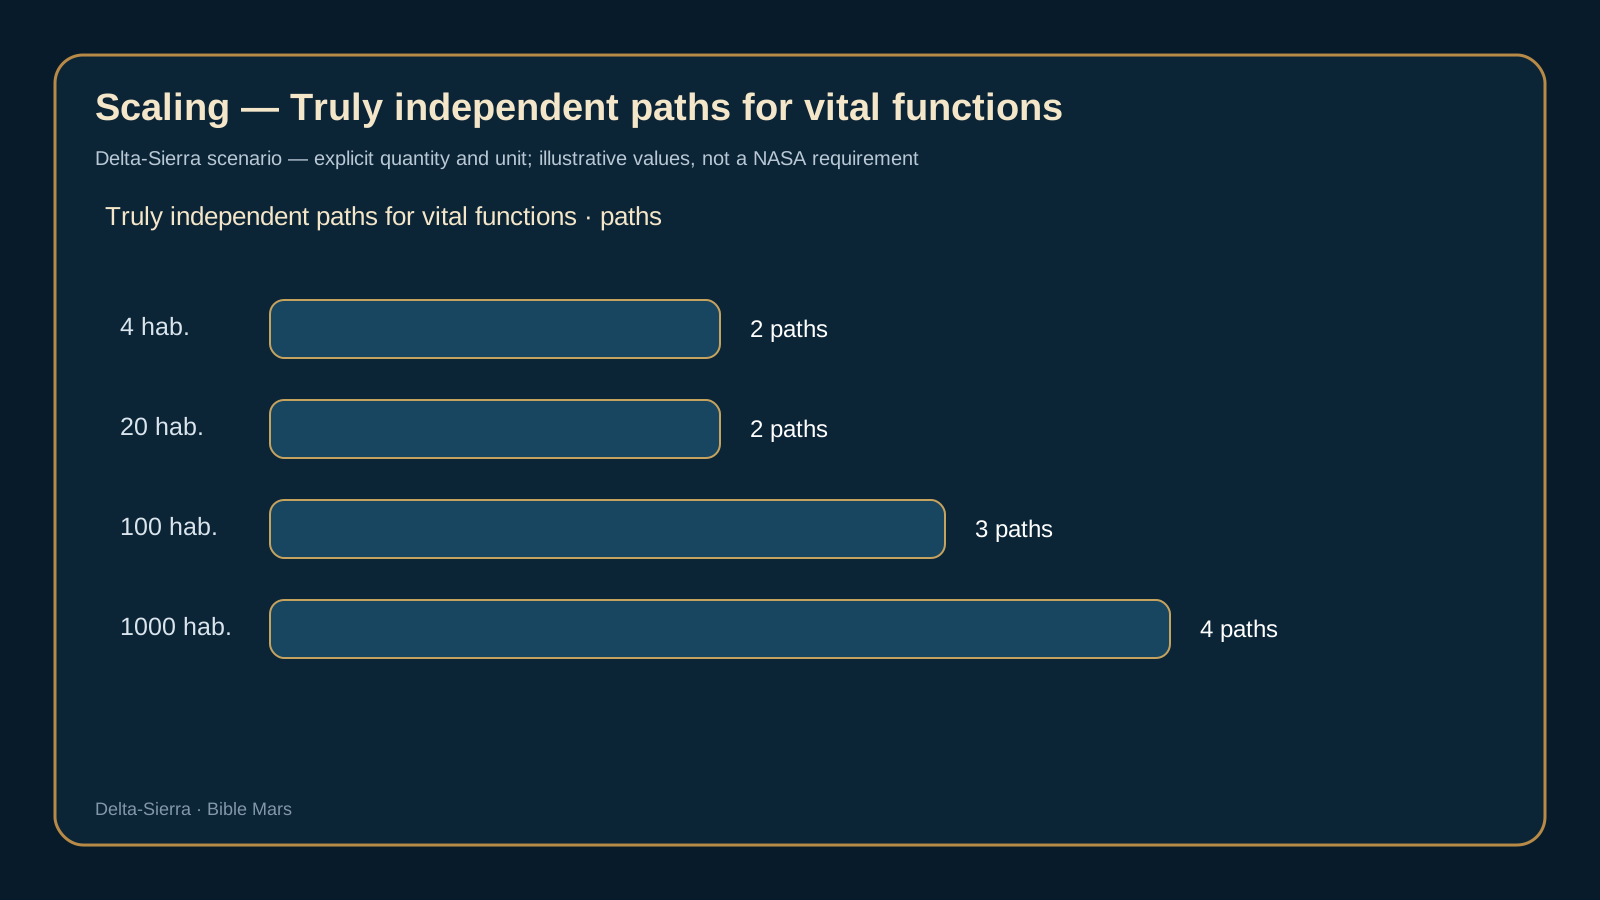
From four to one thousand people, redundancy becomes geographic
With four residents, redundancy may fit inside one compact habitat. At twenty, multiple modules allow physical separation. At one hundred, stocks, workshops and production can be distributed. At one thousand, one power plant, one reservoir or one control room becomes an avoidable concentration of risk. Reliability has become urban design: districts, loops, isolation valves, local reserves and islanded operation.
The strongest maturity evidence is not a brochure availability number. It is a set of scenarios explaining what fails, what remains, what is repaired, which parts are used, who performs the work and how long restoration takes.
Testing recovery matters more than testing failure detection alone
Many tests verify that a system detects a fault and switches to backup. Recovery has its own risks: a valve left closed, software configuration not resynchronized, or a reserve tank depleted by the incident. Full testing should continue until the system returns to a sustainable state. A base that can survive thirty minutes but cannot rebuild margin is not truly resilient.
Exercises should vary assumptions. A clean hard failure is often easier to diagnose than biased sensing, slow leakage or intermittent hardware. Ambiguous scenarios train teams to investigate causes rather than execute a single recipe.
Human reliability should be designed without assuming perfect operators
Labels, ergonomics, procedures, lighting, alarms and tools can reduce error probability. That is more robust than demanding permanent heroic vigilance. The philosophy should match hardware design: assume mistakes will occur, prevent propagation, detect them quickly and make reversal possible.
Deep monograph
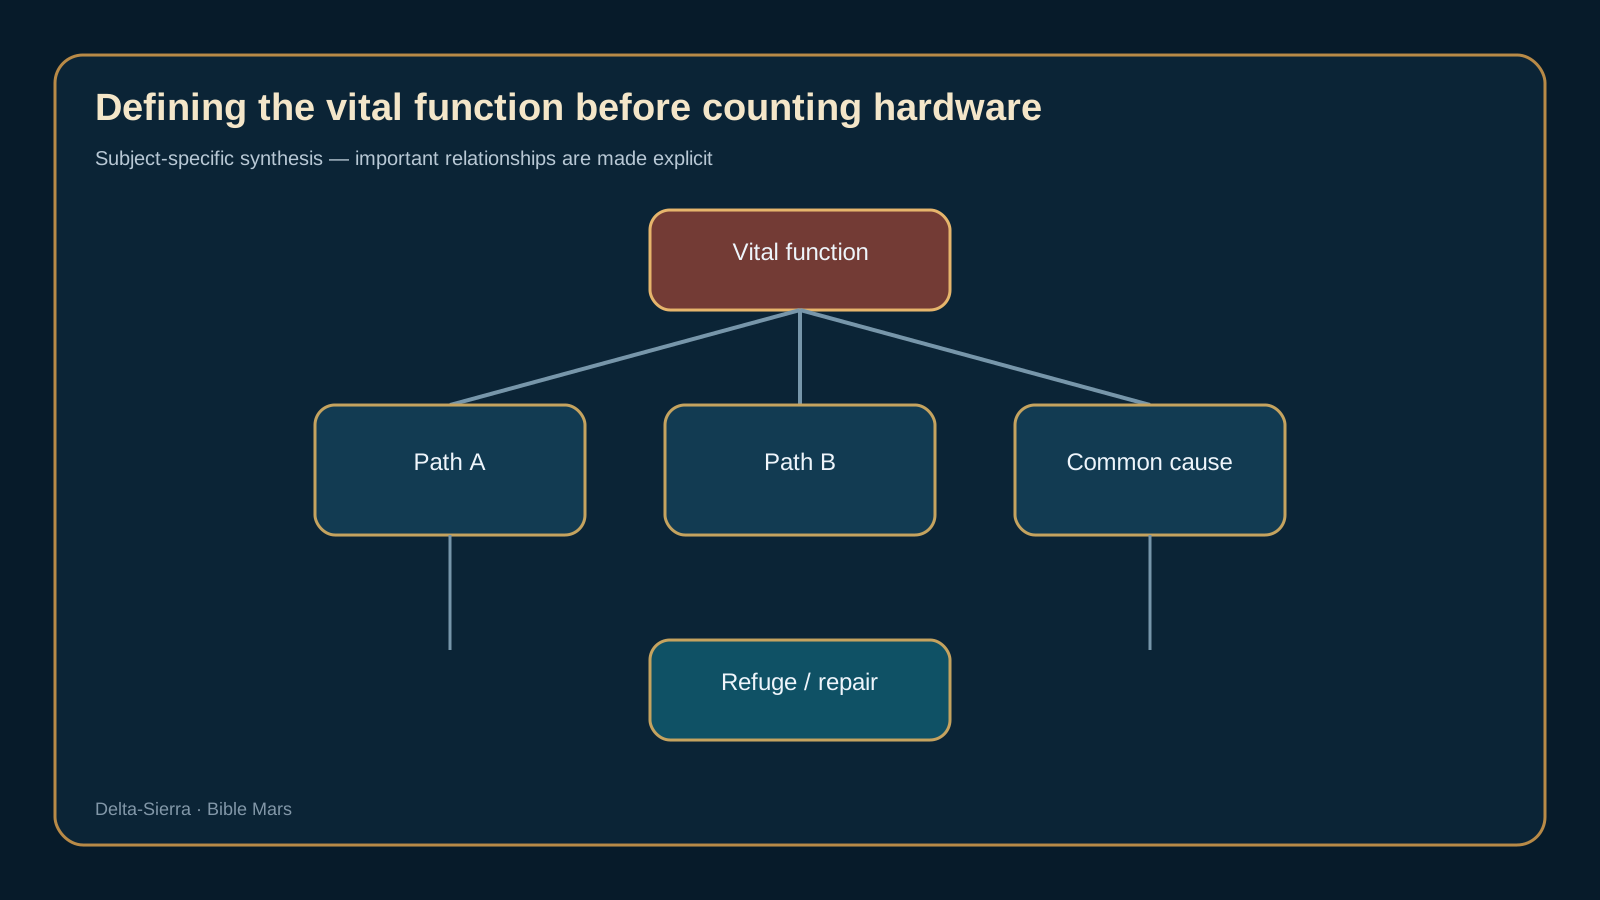
Defining the vital function before counting hardware
Defining the vital function before counting hardware. This chapter is organized around physical and operational mechanisms specific to “Reliability, redundancy and common causes in a Mars base”.
Level-A diagram: main functional flow; details and limitations are explained in the text.Level-B plate: a subject-specific representation that does not replace the data and assumptions stated in the text.
Availability and repairability: how long is the service truly available?
Wrong diagnosis: replacing the good part and keeping the bad one
A false diagnosis can damage a redundant architecture more effectively than a clean failure: the crew removes the healthy channel, leaves the faulty one in service and consumes its own margin. The first defence is a hypothesis tree that separates component failure, sensor error, wiring fault, common production lot, overvoltage, contamination and maintenance error. Each branch needs at least one independent observable; two readings produced by the same computer are not two independent pieces of evidence.
Diagnosis also has to preserve configuration knowledge. Before a module is exchanged, operators record hardware version, software version, symptoms, electrical conditions and the most recent maintenance event. If two channels fail together, replacing the same part twice is less useful than identifying what they share: power, clock, software, environment, procedure or manufacturing lot. Physical separation only provides protection when those common dependencies have also been separated.
Consider a simultaneous rise in memory errors on two computers. A transient bus overvoltage and a fragile component batch can produce similar symptoms but call for different actions. Bus-voltage history, power logs, the spatial distribution of errors and serial-lot records help separate the hypotheses. Until the cause is sufficiently discriminated, the safer strategy is to keep one channel under observation, avoid irreversible reconfiguration and prepare a test capable of falsifying at least one proposed cause.
Reproducible calculations specific to this subject
Availability and repair time
A = MTBF/(MTBF+MTTR); 1 000/(1 000+20)=98,04 %; avec MTTR=5 h → 99,50 %
With the same MTBF, reducing mean repair time from twenty to five hours materially improves availability. On Mars, access, tools and diagnosis can therefore matter as much as intrinsic lifetime.
Three elements in series
Rsys = 0,99³ = 0,9703
If three independent functions are all required and each has mission reliability 0.99, the complete chain falls to about 0.970. Adding series elements can reduce system reliability even when each looks highly reliable.
Two idealized parallel paths
R = 1 − (1 − 0,95)² = 0,9975
A safe haven is useful only if independent from main-volume failures: power, communications, atmosphere and access must avoid the same common causes.
The impressive gain exists only if the two paths fail independently. Shared software, a common parts batch or a common power source can reintroduce common cause and invalidate this optimistic result.
Putting spares and maintenance inside reliability calculations
Twenty people: specialization and the first real reliability workshop
One thousand people: technical authority, certification and field statistics
Scenario chart: quantity, unit and illustrative status are explicit; values are not NASA requirements.
Two identical pumps, one seal batch
Two identical pumps, one seal batch. Two physically separate paths fail within hours because they use seals from the same batch. The independent-redundancy calculation was therefore wrong. The scenario requires tracing batches, suppliers, software, environments and shared procedures.
A faster repair can rival extra redundancy
A faster repair can rival extra redundancy. A simple architecture with excellent access can remain more available than a dual architecture that is nearly impossible to repair. The scenario compares repair time, spares and function loss to decide where mass is better spent: a second machine or a workshop enabling rapid restoration.
Shared software defeats hardware duplication
Shared software defeats hardware duplication. Two different computers execute the same flawed logic and make the same wrong decision. The scenario reminds us that diversity may need to exist in algorithms, data or validation chains, not just hardware boxes.
A very rare catastrophic failure
A very rare catastrophic failure. A very unlikely failure mode would destroy several vital functions at once. Probability alone is not enough to dismiss it when consequence is irreversible. The scenario forces a trade among prevention, physical separation, refuge and recovery capability.
From probabilistic model to a testable Martian architecture
Redundancy improves reliability only when failures are sufficiently independent
Two pumps in parallel appear safer than one. But if they share power, software, seal lot, or a dust intake, one cause can stop both. Mars reliability must therefore distinguish physical multiplicity from independence of failure causes.
For two identical independent components with mission reliability R, a parallel “at least one succeeds” architecture gives Rp = 1 − (1 − R)². If R = 0.95, then Rp = 1 − 0.05² = 0.9975. That dramatic improvement is overstated if a significant common-cause probability exists.
Calculation — availability with repair
A common intrinsic-availability approximation is A = MTBF / (MTBF + MTTR). MTBF is mean time between failures and MTTR mean time to repair. With MTBF = 1,000 h and MTTR = 10 h, A ≈ 1,000/1,010 = 0.9901, or 99.01%. Reducing MTTR to 2 h raises the result to about 99.80%. On Mars, access, tooling, and spares can improve service availability as much as component reliability.
Common cause should be an explicit model variable
FMEA/FMECA examine failure modes and effects; fault trees start from an unwanted top event and trace combinations of causes; Reliability Block Diagrams represent success logic. No single tool is sufficient. A common cause can bypass a clean “two out of three” architecture by attacking all three channels.
A practical review classifies shared dependencies: power, cooling, software, environment, maintenance, and manufacturing origin. Diversity can create barriers through different technology, separated power, independent software, or distinct test procedures. Diversity also increases training and spare complexity.
Reliability is therefore a trade between standardisation and diversity. Identical hardware simplifies training and spares; different hardware reduces some common causes. A Mars base should decide deliberately where standardisation wins and where diversity protects a life-critical service.
Maintainability converts failure probability into service-outage duration
An imperfect system can remain highly available if faults are detected quickly, access is simple, spares exist, and requalification is short. A very reliable component buried behind fifteen hours of disassembly can become the operational bottleneck. Design should follow the timeline from first symptom to evidence of restored service.
That timeline includes detection, diagnosis, safing, access, removal, repair or replacement, reassembly, calibration, functional test, and enhanced monitoring. Connectors, test points, tools, documentation, and standard parts can reduce each segment.
Four common causes to simulate before claiming “N+1”
The same software defect is deployed to every channel
Three computers execute the same mistake. Hardware redundancy does not help. Rollback, safe versions, or design diversity may be required for critical functions.
Dust blocks several intakes at once
Separate filters still share the environment. Physical separation, branch isolation, and cleaning capability become the barriers.
A manufacturing lot contains the same latent defect
Stored spares may share the installed unit’s weakness. Lot traceability and diversified inventory can be reliability tools.
A maintenance error is repeated across redundant equipment
An ambiguous procedure or wrong tool can insert the same fault into two channels during one work campaign. Independent verification and requalification may provide more value than a third copy.
Settlement reliability should be managed as a portfolio of critical services
With four people, failures can be managed with intense human attention. With hundreds, the base needs trends, backlog, failure rates, spare consumption, and repair-time data. Metrics should drive stock, redesign, and inspection decisions rather than exist as decorative scores.
An air service depends on power, sensors, ventilation, scrubbing, valves, software, and pressure structure. The useful decision level is therefore the service. One pump may be failed while service remains available; conversely every component can report green while a shared interface blocks the function.
NASA Safety and Mission Assurance maintains a Reliability & Maintainability discipline and the active NASA-STD-8729.1A standard. Delta-Sierra uses that framework to emphasise failure analysis, maintainability, common causes, and evidence of restored service; it does not treat the standard as a numerical guarantee for a hypothetical Mars base.
Chapter-specific synthesis diagram.
Case study — do not confuse nominal redundancy with independence
Five series functions each with R_i = 0.99 give R_series = ∏R_i = 0.99⁵ ≈ 0.951. R_i is each function's reliability over the interval and R_series the full-chain reliability. Individually 99% elements therefore yield only about 95.1% when every function is required.
Two pumps can share power, software, contaminated fluid or procedure. A common cause bypasses the naive calculation of two independent failures.
FMEA, fault trees and switchover tests must demonstrate that the backup path does not depend on the initiating fault and that repair is feasible with available resources.
Common-cause dependence: two channels are not two independent probabilities
A simple probability example shows why independence must be justified rather than assumed. If one channel has a mission failure probability p = 0.01, two independent channels would both fail with probability p² = 0.0001. Now suppose a simplified beta-factor model assigns ten percent of the single-channel failure probability to causes capable of defeating both channels. The common-cause contribution is then roughly βp = 0.001, while the remaining independent contribution is about [(1−β)p]² ≈ 0.000081. The combined order of magnitude is therefore about 0.00108, more than ten times the value obtained by blindly squaring p. The beta-factor model is only a screening model, but it makes the dependence visible.
The engineering response is not to add more identical boxes. Power separation, software diversity, different sensing principles, physical distance, environmental isolation and independent test paths each attack a different common dependency. Evidence should therefore record which dependency a measure actually breaks. Two computers on separate brackets but fed by one converter are mechanically separated yet electrically coupled; two independent power feeds running the same faulty software are electrically diverse yet logically coupled. Reliability claims become credible only when the claimed independence can be traced to architecture and test evidence.
Dormant failures: redundancy must be tested before it is needed
A redundant channel can be present on a diagram and still be unavailable when demanded. A valve may be stuck, a battery may have lost capacity, a dormant software image may no longer boot against the current configuration, or a supposedly isolated sensor may share a failed reference. These latent faults are dangerous because ordinary operation provides little evidence about the backup path. Proof testing therefore has to exercise the actual switchover chain: detection, command, power transfer, data routing and return to a known configuration. The test interval is an engineering variable. Testing too rarely allows hidden failures to accumulate; testing too often can consume mechanisms, crew time or limited restart cycles.
Suppose a dormant backup has an approximately constant dangerous-failure rate of 2×10⁻⁴ per hour and is proof-tested every 1,000 hours. For a simple first-order screening estimate, the average probability that a hidden failure is present between tests is roughly λT/2 ≈ 0.10, where λ is the latent-failure rate and T the test interval. Halving the interval to 500 hours reduces that screening value to about 0.05, but doubles test demand. The numbers are illustrative rather than a component prediction; the point is that test frequency, wear and diagnostic coverage belong in the same trade.
Human and support resources can also become a common cause. Two independent pumps do not create two independent recovery paths if both require the same inaccessible tool, the same calibration source or the same specialist who is already committed to another emergency. Reliability analysis should therefore include repair access, test equipment, configuration data and crew competence as shared resources. A useful fault tree makes those dependencies visible before the settlement discovers them during a real double failure.
The same reasoning applies to cooling, communications, data storage and crew procedures whenever apparently separate protections still depend on one shared resource.
Decision case — two redundant air trains fail together: double failure or common cause?
Two air-processing trains that are labelled redundant raise a low-flow alarm within minutes of each other. Replacing two fans would be an intuitive but weak response. Diagnosis begins by listing dependencies that the functional diagram may hide: power conversion, timing, software build, reference sensor, calibration procedure, filter lot and thermal environment. A common cause often lives in those shared layers rather than in the two headline units.
The test plan deliberately creates measurement independence. A separate test supply, a local off-network readout, a portable reference sensor or a temporary known-good software image can break one dependency at a time. If both trains recover when the shared reference is removed, the lesson is not that redundancy “failed”; it is that the architecture counted two branches while leaving a single point of interpretation underneath them.
The corrective action can then change the system rather than only the broken part: separate a supply, diversify one sensor technology, stagger maintenance, preserve a fallback software baseline or add a proof test that exposes latent coupling. Useful reliability is the probability that the service survives plausible events, including events that cross nominally independent branches.
Latent failures make standby redundancy less valuable than it looks
A standby unit can be counted as redundant for months while already incapable of starting. A stuck valve, discharged backup battery, seized bearing or corrupted software image may remain invisible until the primary path fails. Reliability analysis therefore needs proof tests whose interval is shorter than the time over which an undetected failure becomes unacceptable.
The proof test must exercise the function that matters. Checking that a controller powers up does not prove that it can take control of a loaded process. For critical services, testing may require a brief transfer of real load, an independent sensor comparison or a simulated fault that forces the backup path to act. The test itself also creates risk, so frequency is a trade between hidden-failure exposure and disturbance of a healthy system.
Common-cause models are warnings about assumptions, not magic constants
When two channels use the same power converter, software library or calibration reference, the independence assumption in simple parallel-reliability equations is weakened. A beta-factor model can represent a fraction of failures as common to both channels, but the numerical beta is meaningful only if it comes from a justified engineering argument or data set. It should not be copied from an unrelated industry and treated as a property of Mars hardware.
The useful design question is which mechanism could defeat both branches and what evidence shows that the mechanism has been controlled. Physical separation addresses some hazards; technology diversity addresses others; independent verification can catch a shared design error; separate maintenance intervals can reduce simultaneous human-induced faults. Different mechanisms require different defenses.
Diversity buys independence at the price of logistics and training
Using two different technologies for the same vital function can prevent one design defect from disabling both. It can also double spare families, diagnostic procedures, software toolchains and training. A settlement with four people may be safer with two identical, well-understood units plus a simple emergency fallback than with two sophisticated but unrelated systems that nobody can repair deeply.
Diversity should therefore be concentrated where a credible common cause dominates the risk. Power conversion, oxygen measurement or emergency communications may justify independent principles or suppliers, while less critical functions can exploit standardization. Reliability becomes a resource-allocation problem: spend complexity where it breaks a dangerous dependency, not everywhere.
Service availability links probability to repair capacity
A low failure rate does not guarantee a highly available service if repair takes weeks. Conversely, a component that fails more often can support a dependable service if faults are detected early, access is easy and restoration is fast. MTBF and MTTR are therefore useful only when their boundaries are explicit: what counts as a failure, when the repair clock starts and whether waiting for a specialist or spare is included.
For a settlement, the service is the right unit of analysis. A water loop can remain available while one pump is down if the alternate path carries the required load; a rover fleet can preserve medical transport even with several vehicles unavailable. Reliability engineering should connect component events to the capability residents actually need.
Compound emergencies reveal dependencies that single-fault tests miss
Imagine a dust event that reduces solar generation while one air-processing train is under maintenance and a crewed rover requests emergency charging. None of those events is extraordinary by itself, yet they compete for the same power margin, technician time and communication attention. A base that passes three isolated tests can still fail when ordinary disturbances overlap.
Exercises should therefore include timed combinations chosen from the dependency map. The objective is not theatrical catastrophe; it is to expose shared bottlenecks while enough options remain to redesign them. A robust architecture preserves a safe state, makes priorities explicit and gives operators a way to shed non-critical loads before a local problem becomes a settlement-wide cascade.
Fault trees should be connected to physical layout and operating procedure
A fault tree can show that two branches are logically redundant while the installation places both behind the same bulkhead, cooling loop or maintenance access. Physical review is therefore part of reliability analysis. A fire, leak or debris event does not respect the boxes of a block diagram. Walk-downs, cable routing review and common-zone analysis reveal dependencies that probability tables alone may miss.
Operating procedure can create the same problem. If both redundant units are taken down for the same scheduled calibration, the service has an intentional common outage. Staggering maintenance, testing one branch while the other carries load and defining a protected minimum configuration can remove that vulnerability without changing any hardware.
Reliability data must distinguish population, environment and failure definition
A failure rate measured for electronics in a controlled terrestrial room is not automatically a failure rate for the same electronics near a dusty airlock, inside a warm pressure vessel or on an external rover. Temperature cycles, radiation, maintenance frequency and load profile change the mechanisms. Even the word “failure” may differ: a recoverable reset, a degraded sensor and complete loss of function should not be pooled without explanation.
Local data should therefore be tagged by configuration and environment. As the settlement accumulates operating hours, it can update priors and compare predicted with observed events. The goal is not to manufacture a precise-looking MTBF; it is to learn which assumptions are holding and which parts of the architecture need redesign, more spares or stronger monitoring.
Graceful degradation needs a defined minimum service, not a vague promise to “keep operating”
When redundancy is lost, the remaining branch may be capable of only part of the normal load. The architecture should state which residents and functions retain service, for how long, and what must be shed. A water system might preserve drinking and hygiene while suspending industrial use; a power network might protect thermal control and communications while delaying charging and manufacturing.
These degraded states should be rehearsed because operators otherwise discover their interactions during the emergency. Load shedding can change temperatures, pressure balance, data queues or maintenance access. Reliability becomes operationally meaningful when each critical service has a known minimum state and a path back to nominal operation.
FMEA and fault trees answer different questions and should meet in the middle
A failure-modes-and-effects analysis starts from components or functions and asks what each failure does. A fault tree starts from an unacceptable top event and asks which combinations can create it. Using both prevents a blind spot: FMEA can reveal local consequences that were never placed in the tree, while the tree exposes combinations and common dependencies that a one-failure-at-a-time table can miss.
For a Martian service, the two analyses should share identifiers for functions, detection methods and recovery actions. When testing discovers a new failure mode, both representations are updated. Reliability documentation then becomes a living map of how real hardware, software and operations produce or prevent loss of service.
Small samples require humility in reliability claims
A settlement may operate only a handful of identical life-support units. Ten thousand failure-free hours are useful evidence, but they do not justify the same statistical confidence as millions of fleet hours on Earth. Early reliability estimates should therefore show uncertainty and combine test evidence, physics-of-failure reasoning and observed field data rather than publishing a single precise MTBF as if it were measured truth.
The practical consequence is conservative decision-making where uncertainty is large. Proof tests, inspections and recoverable degraded modes can compensate for limited statistics until enough local history exists to revise the model. The objective is to reduce surprise, not to produce an impressive number of decimal places.
Reliability growth should close the loop between anomaly, test and redesign
After an anomaly, the fastest path back to nominal operation is not always the fastest path to a safer system. The investigation should preserve failed parts, telemetry and configuration so that the mechanism can be reproduced. A corrective action is stronger when a targeted test makes the original failure recur and then demonstrates that the change removes it without creating another dependency.
Over time, this creates reliability growth rather than a sequence of repairs. Repeated seal leaks may justify a material change; recurring software resets may expose timing or resource limits; several unrelated faults during one maintenance shift may reveal a human-workload problem. The settlement should track which corrective actions actually reduce recurrence and retire assumptions that local evidence no longer supports.
From a reliability number to a settlement decision
A reliability claim becomes useful only when the time interval, the service boundary and the repair assumptions are named. A component can have a long mean time between failures and still support a fragile service if the settlement needs many hours to detect, reach, replace and requalify it. For a repairable function, a first-order availability estimate is A ≈ MTBF / (MTBF + MTTR). Here A is the fraction of time the service is available, MTBF is mean time between failures and MTTR is mean time to restore service; both time quantities must use the same unit, such as hours. If MTBF is 4,000 h and MTTR is 12 h, A ≈ 4,000 / 4,012 ≈ 0.9970, or 99.70 %. That number sounds excellent, but it says nothing about a shared power bus, a contaminated spare batch or a diagnostic error that disables two channels at once. The calculation therefore opens the discussion; it does not close it.
Parallel redundancy is especially easy to overstate. If two channels each have a mission-period failure probability q = 0.01 and their failures are genuinely independent, the probability that both fail in the same period is approximately q² = 0.0001, or 0.01 %. Independence is the decisive word. Suppose instead that a common mechanism contributes a probability of order 0.001 over the same interval. That common-cause contribution is already ten times larger than the naïve double-independent-failure term. A beta-factor or another common-cause model can help organize the reasoning, but its coefficient is not a universal Martian constant: it has to be supported by design knowledge, testing and field evidence. Physical separation, diverse sensing, independent software builds and different maintenance pathways are valuable only when they break a credible shared failure path.
Standby equipment creates a different trap because a dormant failure can remain invisible until the backup is demanded. For a simple constant dormant-failure rate λ and a proof-test interval T, the average probability that a hidden fault is present can be approximated, when λT is small, by P ≈ λT/2. If λ = 2 × 10⁻⁵ h−1 and the standby unit is functionally tested every 720 h, then P ≈ (2 × 10−5 × 720)/2 ≈ 0.0072, or 0.72 %. Halving the test interval approximately halves this dormant exposure, but it also consumes crew time, cycles valves and relays, and may itself introduce maintenance errors. The correct interval is therefore a trade between hidden-failure exposure and the burden and risk of proof testing.
Repair time should also be decomposed rather than treated as one optimistic number. Imagine a carbon-dioxide removal service whose failed valve requires 1.5 h to diagnose, 2 h to make the worksite safe and accessible, 3 h to replace the item, and 2.5 h for leak checks, calibration and functional proof. The technical replacement lasts 3 h, but the service-restoration time is 1.5 + 2 + 3 + 2.5 = 9 h. If the crew lacks the correct test fixture, the last 2.5 h can become days. A spare-parts policy must therefore include the tooling, software, calibration references and consumables needed to prove that a repair has actually restored the function. Counting boxes on a shelf is not the same as owning a recovery capability.
Reliability management at settlement scale also needs a service view. Oxygen control, heat rejection, communications, mobility and electrical distribution do not have identical acceptable outage durations. A comfort subsystem may tolerate hours of interruption, while pressure control can demand action in seconds or minutes. The architecture should therefore define a minimum safe service for each critical function and the transitions that preserve it: full service, degraded service, emergency reserve and safe shutdown. This makes graceful degradation testable. During an integrated exercise, operators should be able to state which residents remain protected, for how long, with which consumption rate and what evidence would force the next transition.
Finally, field data must be collected in a form that can improve the model instead of merely filling a logbook. Every significant anomaly should preserve the equipment configuration, software version, environment, precursor symptoms, diagnostic path, replaced items, repair duration and proof-test result. A failure after 3,000 h in dusty exterior service cannot be pooled blindly with a failure after 3,000 h in a clean pressurized rack. With small populations, confidence intervals will remain wide; that is a reason to retain context, not to invent precision. The purpose of the reliability model is to make assumptions visible, connect them to physical mechanisms and update decisions as local evidence accumulates.
NASA NTRS — Common Cause Failures Dominate and Defeat Redundancy — This study is integrated into the distinction between redundancy and independence. Two identical units do not protect against a shared design error, environment or maintenance procedure; diversity and separation of causes become architecture variables.
NASA NTRS — Limitations of Reliability for Long-Endurance Human Spaceflight — The document is used to explain why extrapolating mission-success probability from a short mission to many years can create false precision. Martian availability must combine reliability, repair, spares, diagnosis and reconfiguration.
NASA NTRS — Supportability Concepts for Crewed Deep Space Exploration — Supportability complements reliability: a system may fail yet remain acceptable if detection, access, skill, tooling and spares exist. The page uses this to shift the goal from “never fail” to “continue delivering service.”
Sources and documentary findings
Defining the vital function before counting hardware: the references below are retained because they contribute a result, technology status or verification framework directly useful to this subject.
NASA Standards — Safety, Quality, Reliability, Maintainability
NASA’s standards catalog includes R&M, metrology, EEE-parts assurance, wiring and software standards. For Martian industry, quality therefore cannot be separated from process traceability and configuration control.
CHAPEA Mission 2 began on Oct. 19, 2025 for 378 days with four volunteers. NASA simulates limited resources, prolonged isolation, communication delays up to 22 minutes and equipment failures, making it useful for observing workload and decision autonomy.